How to explore and visualize ML data for object detection in images

In recent years, people have increasingly recognized the need for a deep understanding of machine learning data (ML-data). However, given that detecting large data sets often requires a lot of manpower and material resources, its widespread application in the field of computer vision still needs further development.
Usually, in object detection (a subset of computer vision), objects in the image are positioned by defining bounding boxes. Not only can the object be identified, but the context, size, and relationship between the object and other objects in the scene can also be understood. relationship of elements. At the same time, a comprehensive understanding of the distribution of classes, the diversity of object sizes, and the common environments in which classes appear will also help to discover error patterns in the training model during evaluation and debugging, so that additional training data can be selected more targeted .
In practice, I often take the following approach:
- Leverage pretrained models or enhancements to base models to add structure to your data. For example: creating various image embeddings and employing dimensionality reduction techniques such as t-SNE or UMAP. These can generate similarity maps to facilitate data browsing. In addition, using pre-trained models for detection can also facilitate context extraction.
- Use visualization tools that can integrate such structures with statistical and review capabilities of the raw data.
Below, I 'll describe how to use Renomics Spotlight to create interactive object detection visualizations. As an example I'll try:
- Build visualizations for people detectors in images.
- Visualizations include similarity maps, filters, and statistics for easy exploration of the data.
- View every image with ground truth and Ultralytics YOLOv8 detection details.
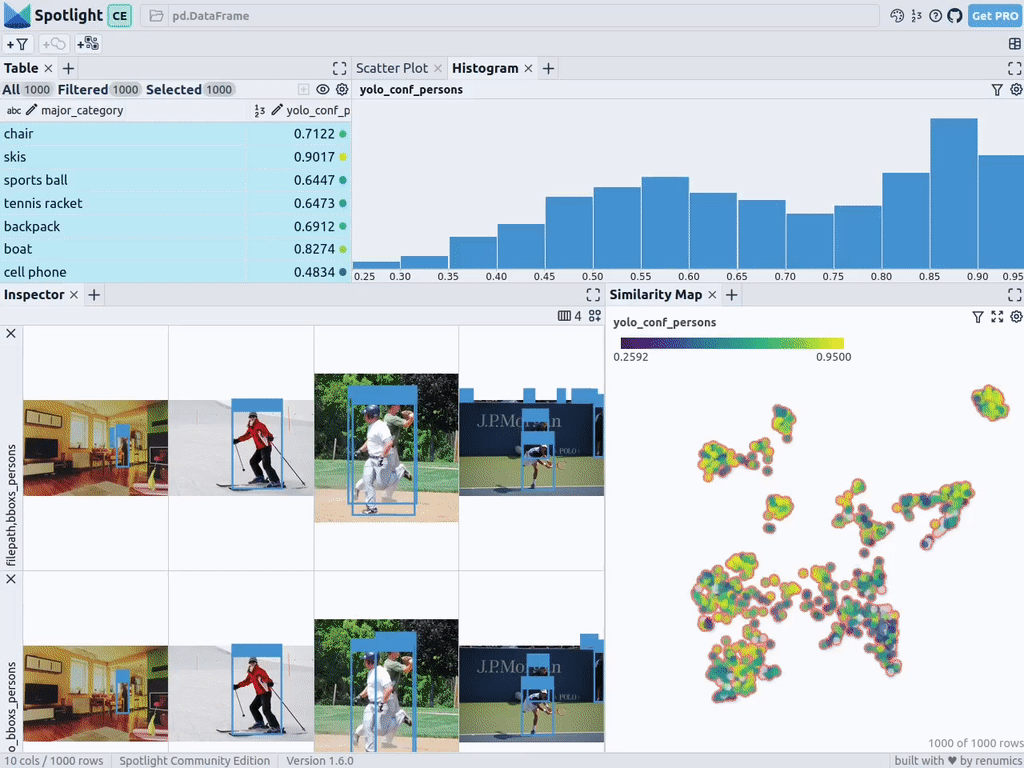
Target visualization on Renomics Spotlight. Source: Created by the author
Download images of people in the COCO dataset
First, install the required packages via the following command:
!pip install fiftyone ultralytics renumics-spotlight- 1.
Using FiftyOne 's resumable download feature, you can download various images from the COCO dataset. With simple parameter settings, we can download 1,000 images containing one or more people. The specific code is as follows:
importpandasaspd
importnumpyasnp
importfiftyone.zooasfoz
# 从 COCO 数据集中下载 1000 张带人的图像
dataset = foz.load_zoo_dataset(
   "coco-2017"、
    split="validation"、
    label_types=[
       "detections"、
    ],
    classes=["person"]、
   max_samples=1000、
    dataset_name="coco-2017-person-1k-validations"、
)- 1.
- 2.
- 3.
- 4.
- 5.
- 6.
- 7.
- 8.
- 9.
- 10.
- 11.
- 12.
- 13.
- 14.
Next, you can use code like this:
def xywh_too_xyxyn(bbox):
   "" convert from xywh to xyxyn format """
   return[bbox[0], bbox[1], bbox[0] + bbox[2], bbox[1] + bbox[3]].
行 = []
fori, samplein enumerate(dataset):
    labels = [detection.labelfordetectioninsample.ground_truth.detections] bboxs = [...
    bboxs = [
        xywh_too_xyxyn(detection.bounding_box)
       fordetectioninsample.ground_truth.detections
    ]
    bboxs_persons = [bboxforbbox, labelin zip(bboxs, labels)iflabel =="person"] 行。
    row.append([sample.filepath, labels, bboxs, bboxs_persons])

df = pd.DataFrame(row, columns=["filepath","categories", "bboxs", "bboxs_persons"])
df["major_category"] = df["categories"].apply(
   lambdax:max(set(x) -set(["person"]), key=x.count)
   if len(set(x)) >1
   else "only person"。
)- 1.
- 2.
- 3.
- 4.
- 5.
- 6.
- 7.
- 8.
- 9.
- 10.
- 11.
- 12.
- 13.
- 14.
- 15.
- 16.
- 17.
- 18.
- 19.
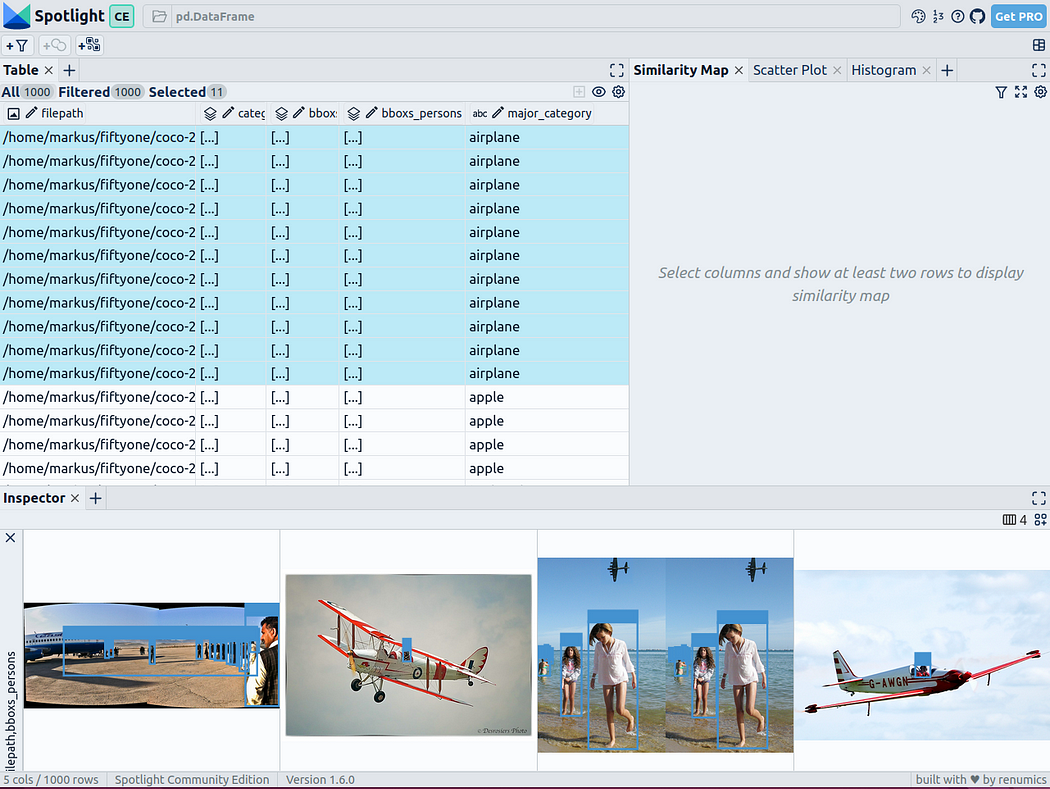
Prepare the data as a Pandas DataFrame with columns including: file path, bounding box category, bounding box, person contained in the bounding box, and main category (despite the person) to specify the context of the person in the image:

You can then visualize it via Spotlight:
From renumics import spotlight
spotlight.show(df)- 1.
- 2.
You can use the add view button in the inspector view and select bboxs_persons and filepath in the border view to display the corresponding border with the image:
Embed rich data
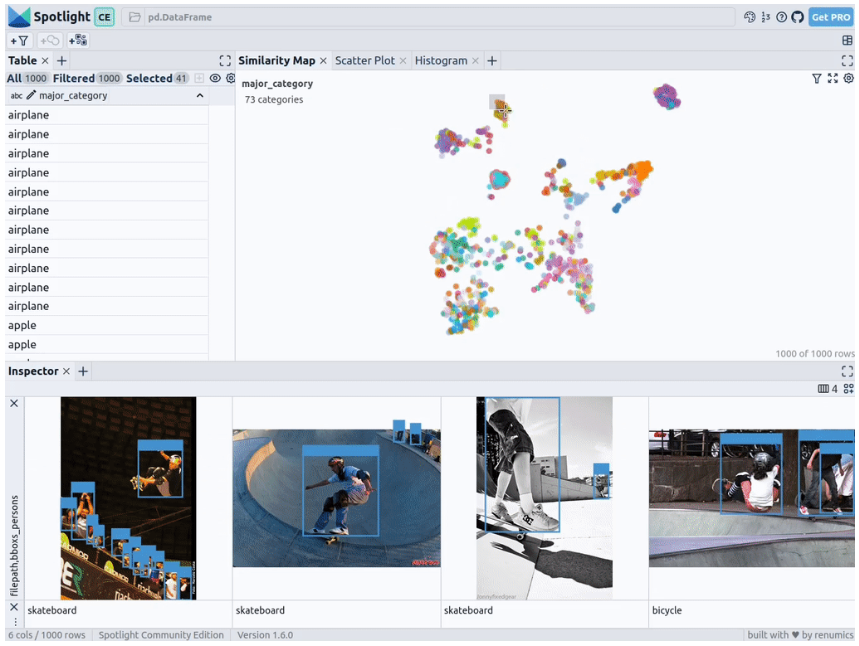
To make the data structured, we can use image embeddings (i.e. dense vector representations) of various basic models. To do this, you can use further dimensionality reduction techniques such as UMAP or t-SNE to apply Vision Transformer (ViT) embeddings of the entire image to the structuring of the dataset, thus providing a 2D similarity map of the image. Additionally, you can use the output of a pretrained object detector to structure your data by classifying it by the size or number of objects it contains. Since the COCO dataset already provides this information, we can use it directly.
Since Spotlight has integrated support for the google/vit-base-patch16-224-in21k (ViT) model and UMAP , it will be automatically applied when you create various embeds using file paths:
spotlight.show(df, embed=["filepath"])- 1.
With the above code, Spotlight calculates the various embeddings and applies UMAP to display the results in a similarity map. Among them, different colors represent the main categories. From this, you can use similarity maps to explore your data:
Results of pre-training YOLOv8
Ultralytics YOLOv8 , which can be used to quickly identify objects , is a set of advanced object detection models . It is designed for fast image processing and is suitable for a variety of real-time detection tasks, especially when applied to large amounts of data, so users do not need to waste too much waiting time.
To do this, you can first load the pretrained model:
From ultralytics import YOLO
detection_model = YOLO("yolov8n.pt")- 1.
- 2.
and perform various detections:
detections = []
forfilepathindf["filepath"].tolist():
    detection = detection_model(filepath)[0]
    detections.append(
        {
           "yolo_bboxs":[np.array(box.xyxyn.tolist())[0]forboxindetection.boxes]、
           "yolo_conf_persons": np.mean([
                np.array(box.conf.tolist())[0].
               forboxindetection.boxes
               ifdetection.names[int(box.cls)] =="person"]), np.mean(
            ]),
           "yolo_bboxs_persons":[
                np.array(box.xyxyn.tolist())[0]
               forboxindetection.boxes
               ifdetection.names[int(box.cls)] =="person
            ],
            "yolo_categories": np.array(
                [np.array(detection.names[int(box.cls)])forboxindetection.boxes], "yolo_categories": np.array(
            ),
        }
    )
df_yolo = pd.DataFrame(detections)- 1.
- 2.
- 3.
- 4.
- 5.
- 6.
- 7.
- 8.
- 9.
- 10.
- 11.
- 12.
- 13.
- 14.
- 15.
- 16.
- 17.
- 18.
- 19.
- 20.
- twenty one.
- twenty two.
On a 12GB GeForce RTX 4070 Ti, the above process can be completed in less than 20 seconds. You can then include the results in a DataFrame and visualize them using Spotlight. Please refer to the following code:
df_merged = pd.concat([df, df_yolo], axis=1)
spotlight.show(df_merged, embed=["filepath"])- 1.
- 2.
Next, Spotlight will calculate the various embeddings again and apply UMAP to display the results in a similarity map. This time, however, you can choose the confidence level of the model for detected objects and use the similarity map to navigate retrieval among less confident clusters. After all, given that the model of these images is indeterminate, they usually share a certain degree of similarity.
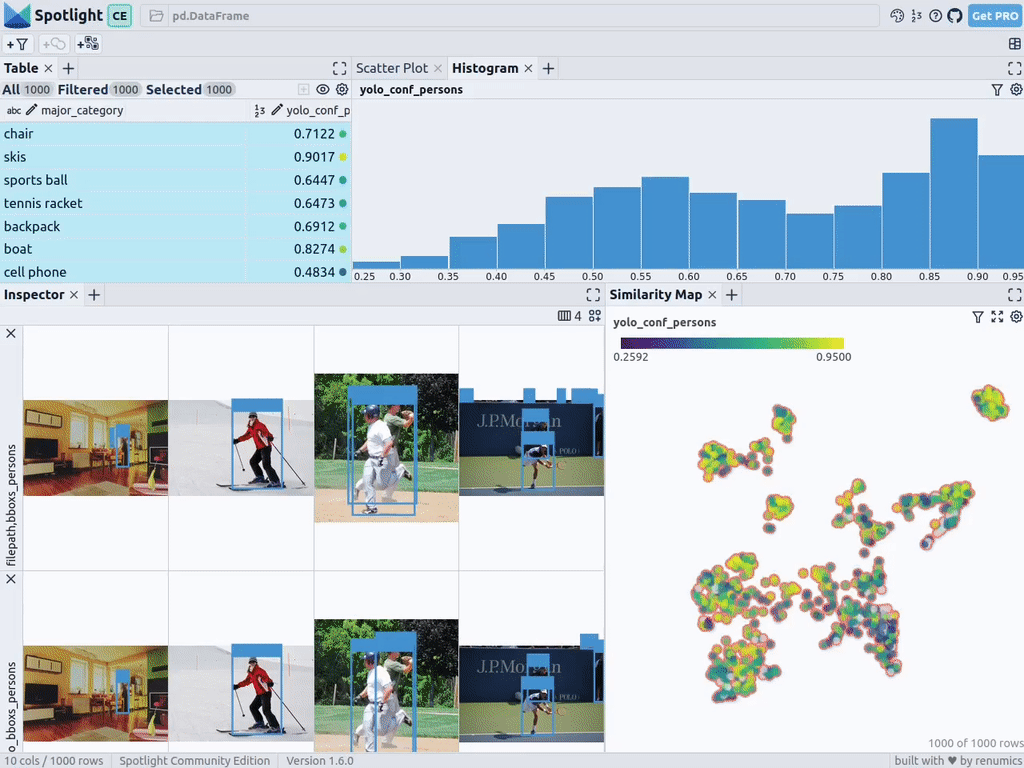
Of course, the above brief analysis also shows that this type of model will encounter systemic problems in the following scenarios:
- Due to the huge size of the train, people standing outside the carriage look very small.
- For buses and other large vehicles, the people inside are barely visible
- Someone is standing outside the plane
- Close-up picture of someone's hand or fingers on food
You can determine whether these issues actually impact your person detection goals, and if so, you should consider augmenting the dataset with additional training data to optimize model performance in these specific scenarios.
summary
In summary, the use of pre-trained models and tools such as Spotlight can make our object detection visualization process easier, thereby enhancing the data science workflow. You can try and experiment with the above code using your own data.
Translator introduction
Julian Chen, 51CTO community editor, has more than ten years of experience in IT project implementation. He is good at managing and controlling internal and external resources and risks, and focuses on disseminating network and information security knowledge and experience.
Original title: How to Explore and Visualize ML-Data for Object Detection in Images, author: Markus Stoll
Link: https://itnext.io/how-to-explore-and-visualize-ml-data-for-object-detection-in-images-88e074f46361.