Research on 5G Capacity Expansion Benchmark Based on User Service Awareness

Research on 5G Capacity Expansion Benchmark Based on User Service Awareness

The Establishment of the Cell Capacity Baseline in the Network Includes the Follow Factors: SCENARIOS, TRAFFIC, Resource Utilization, User CaPacity, ET c . expansion threshold. What is the relationship between the expansion threshold and the user's service perception satisfaction is the research goal of this topic. We need to combine wireless resource capacity capabilities with user service perception, comprehensively evaluate cell capacity cap abilities, improve user service experience, and stimulate rapid growth of network traffic.

Research the uplink and downlink rate balance and wireless performance satisfaction of typical services in large, medium and small packet scenarios under high load.
Research high-load, large, medium, and small packet scene video categories, and obtain the corresponding relationship between video service perception and wireless KPI baselines according to different classification dimensions (long and short video ratios, resolution ratios, etc. ) and wireless load associations.
Study the relationship between the proportion of vEMI perceived by typical video services and the wireless environment (good, medium, almost) corresponding to speed and resolution, and the key monitoring indicators for capacity expansion corresponding to 80% satisfaction of vEMI .
Research the relationship between dispatching capability and perceived satisfaction of video services, number of users (average number of activated and connected users), and expansion KPI baseline in high-load small-packet scenarios.

Find out the business distribution and characteristic conclusions in different scenarios
The uplink/downlink busy hours are inconsistent, and the uplink and downlink busy hours need to be counted separately.
The uplink and downlink capacity is unbalanced, and the uplink capacity of a certain proportion of cells is limited in advance.
The downlink needs to pay attention to the video service, and the uplink needs to pay attention to the instant messaging service.
Based on the mainstream video service experience, the baseline standard for mapping and expansion KPI indicators is given, and the recommended baseline standard for different frequency bands is given.
Based on the analysis based on VEMI-Q=3.0, under different scenarios of large, medium and small packets, the traffic baseline based on perceived busy hours arrives earlier than the group standard inflection point. The small package is 40GB, the medium package is 60GB, and the large package is 70GB.
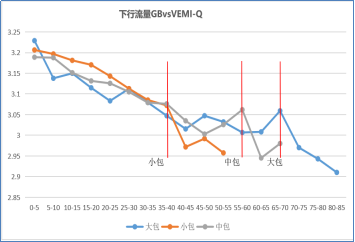
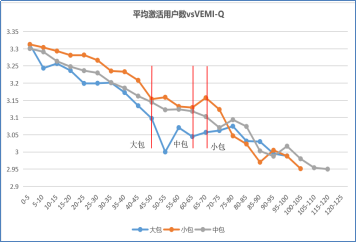
Taking the video service perception satisfaction VEMI-Q=3.0 as the baseline, the areas with large, medium and small-package cells corresponding to the large-package and small-packet cells have a sharp drop in perception around the area of 45 large-package users, 60 medium-package users, and 70 small-package users.
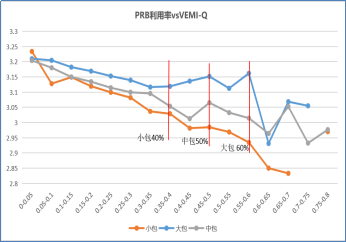
With the increase of PRBs, the VEMI-Q of large, medium and small cells has a downward trend; taking the video service perception satisfaction VEMI-Q=3.0 as the baseline, the PRB utilization rate needs to meet the requirements of 40% for small packets, 50% for 60% of the requirement.
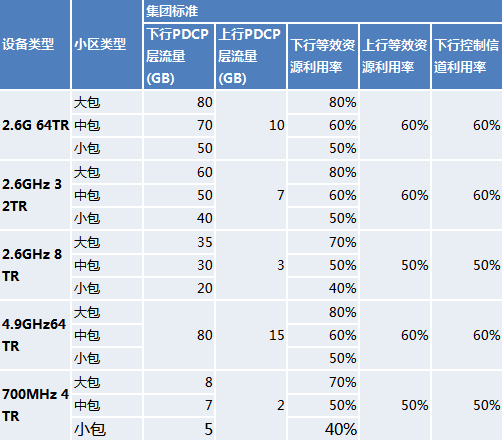
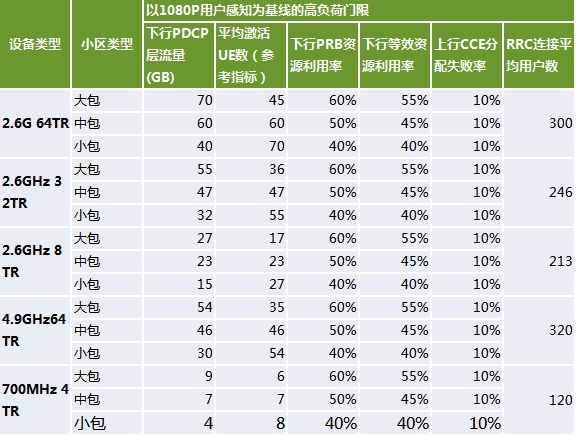
Video services are limited by downlink service channels and uplink CCE scheduling capabilities. Therefore, video user perception may be affected if one of the following conditions is met:
- The downlink service channel is limited: "downlink PDCP layer traffic >= threshold" and "downlink PRB resource utilization >= threshold".
- The control channel is limited: "uplink CCE allocation failure rate >= threshold" and "average number of RRC connected users >= threshold".
Typical video service experience corresponding to wireless network impact test verification conclusion

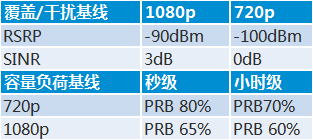
- In order to guarantee the 1080p rate baseline of 10Mbps, VEMI3.5, it is recommended that the SINR baseline be 3dB, the RSRP baseline be -90dBm, and the cell load baseline be (second level) PRB 65%;
- In order to guarantee the 720p rate baseline of 4Mbps, VEMI3, it is recommended that the SINR baseline be 0dB, the RSRP baseline be -100dBm, and the cell load baseline be (second level) PRB 80%;
- When the coverage or capacity exceeds the above baseline, the VEMI will drop sharply at the inflection point, and the initial buffer delay will increase significantly if it is higher than 1s, that is, the perception indicators cannot be guaranteed.

Statistical Comparison of Expanded Residential Areas
Use the group standard and the perception standard to carry out statistics on high-load cells of 2.6G and 700M macro stations in a certain city, and compare the impact of the two standards on the number of high-load cells:
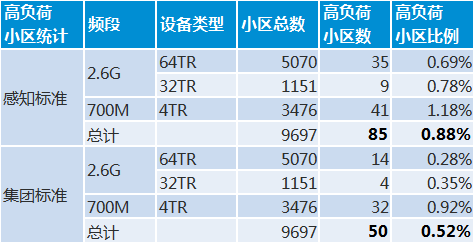
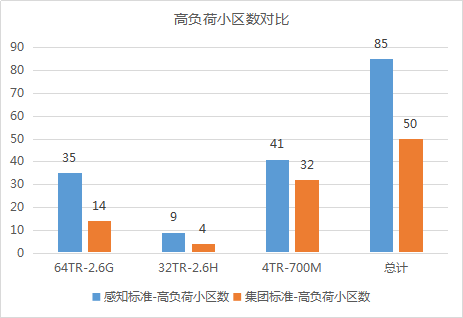
- The perception standard screens out more high-load cells than the group standard, and it is more obvious on 2.6G equipment.
- The 85 high-load cells screened out by the sensing standard all have limited service channels, indicating that the current bottleneck affecting perception is still the service channel, and the control channel is temporarily unrestricted.
- Statistically, 49 of the 50 high-load communities screened out using the group standard also appear in the high-load community screened out by the perception standard, with a high degree of overlap.
- The perception standard can be used as a supplement to the group standard. With 1080P high perception as the standard, it can more accurately find cells with limited perception and serve as a reference for subsequent expansion.

Traditional network O&M is mainly based on network-level KPIs. Network KPIs cannot be correlated with user service experience, making it difficult to optimize perception problems and match cell capacity. A large number of real-world cases and statistical data show that excellent network-side performance indicators do not mean user satisfaction and excellent experience, and user subjective evaluation represented by satisfaction evaluation is an after-the-fact evaluation under the cumulative effect of various factors. In the scenario of large, medium and small packets on the network, the proportion of user services carried by the cell will be different, and the requirements for service satisfaction provided by the cell performance will also be different.
According to the statistics of mobile Internet users in 2022, the usage rate of online videos (including short videos) is as high as 95%, accounting for 63% of the entire network traffic. Douyin and Kuaishou short videos have an average daily usage time of 100+ minutes per capita, surpassing instant messaging applications and growing rapidly. If the video service freezes, 56% of users will give up video playback, and complaints will occur if the experience is not good for a long time.
Traditional 5G capacity expansion standards start from base station KPIs, which cannot accurately evaluate user perception experience. There will be scenarios where user perception in a community is poor but the capacity expansion threshold has not yet been reached. The traditional service perception evaluation system is provided by the big data platform, and the wireless side cannot be built independently, and cross-domain collaboration is difficult.
The 5G perception expansion standard takes the future mainstream 1080P service as the perception baseline, combines video service KPIs with user experience KQIs, and obtains a set of expansion thresholds that are applicable to various scenarios on the existing network, and can more accurately and quickly find perception-limited cells. This standard combines wireless resource capacity capabilities with user service perception to comprehensively evaluate cell capacity capabilities.
Scenario-based statistics show that the uplink and downlink busy times are inconsistent, which enlightens us to determine the busy time, and we should consider the busy time period separately for uplink and downlink, so as to accurately describe the limited uplink and downlink perceived capacity of the cell.
Based on the judgment that the perceived capacity baseline is limited, we should also change the concept of capacity expansion, that is, uplink and downlink capacity expansion on demand. For example: the implementation strategy of uplink expansion and downlink expansion is combined with the de vice form provided by the manufacturer, and the most cost-effective expansion solution is selected.