In the first half of the year, Internet companies completed business revenues of 695.1 billion yuan, a year-on-year increase of 25.6%
2021.08.11

Recently, the Ministry of Industry and Information
Technology announced the operation of Internet companies in the first half of
the year. The Internet and related service industries are developing steadily,
with business revenue growing rapidly, operating profit and R&D expenses
maintaining double-digit growth, and segmented areas showing different growth
trends.

1. Overall operation
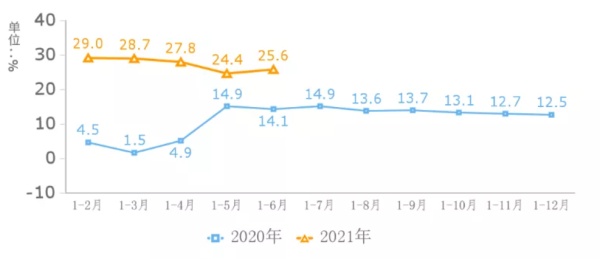
Internet business revenue has grown rapidly. In the first
half of the year, my country's Internet and related service companies above designated
size (Internet companies) completed business revenue of 695.1 billion yuan, a
year-on-year increase of 25.6%, and the growth rate rose 1.2% from January to
May, and the two-year average growth rate reached 19.7%.
Industry profit growth rebounded. In the first half of the
year, Internet companies above designated size achieved operating profits of
65.86 billion yuan, a year-on-year increase of 27.4%, an increase of 14.3
percentage points from January to May, and an average growth rate of 14.4% in
two years.
R&D expenses maintained rapid growth. In the first half
of the year, Internet companies above designated size invested 34.63 billion
yuan in R&D expenses, an increase of 13.9% year-on-year, and the growth
rate increased by 3.2 percentage points year-on-year.
2. Operation status by business
(1) Revenue from information services grew steadily, and the
rapid growth of audio and video services declined. In the first half of the year,
Internet companies completed a total of 397.4 billion yuan in information
service revenue, a year-on-year increase of 15.4%, an increase of 1 percentage
point from January to May; it accounted for 57.2% of Internet business revenue,
a year-on-year decrease of 3.4 percentage points. Among them, the growth rate
of business income of enterprises in the audio and video service sector has
fallen from January to May and the same period of the previous year; online
game companies have achieved small growth, reversing the negative growth
situation from January to May; news and content service companies and search
services are The main business income growth rate has increased from January to
May.
(2) Various platforms are developing vigorously, and the
income from Internet platform services is growing rapidly. In the first half of
the year, Internet companies achieved platform service revenue of 232.6 billion
yuan, a year-on-year increase of 55.3%, and the growth rate increased by 2.8
percentage points from January to May; it accounted for 33.5% of Internet
business revenue, an increase of 4.2 percentage points year-on-year. Among
them, online sales platform companies are growing rapidly, driven by the
"6.18" promotion activities and multi-scenario live broadcasts; life
service platform companies, and companies that mainly provide manufacturing and
production logistics platform services are developing steadily and positively.
; The business income of online education services companies has dropped
significantly year-on-year.
(3) Revenue from Internet access services grew steadily, and
revenue from Internet data services grew rapidly. In the first half of the
year, Internet companies completed 20.07 billion yuan in revenue from Internet
access and related services, a year-on-year increase of 8.3% (a decrease of
5.8% in the same period last year); completed Internet data services (including
cloud services, big data services, etc.) revenue was 10.77 billion yuan, a
year-on-year increase Increased by 23.4%, the growth rate increased by 9.1
percentage points year-on-year.
3. Operation by region
The Internet business income in the eastern region
maintained rapid growth, and the western region had a prominent growth trend.
In the first half of the year, the eastern region completed 588.3 billion yuan
in Internet business revenue, a year-on-year increase of 25.7%, and the growth
rate increased by 1.6 percentage points from January to May. An increase of 0.3
percentage points. The central region completed Internet business revenue of
17.96 billion yuan, a year-on-year decrease of 14.1% (a growth of 26% in the
same period last year). The western region completed Internet business revenue
of 41.21 billion yuan, a year-on-year increase of 47.9%, a year-on-year growth
rate of 35.9 percentage points, an increase of 1.3 percentage points from
January to May, and 22.3 percentage points higher than the national average.
The Northeast region completed Internet business revenue of 2.46 billion yuan,
a year-on-year increase of 18.4% (down 4.8% in the same period last year), and
the growth rate dropped by 4.7 percentage points from January to May.
Major provinces and cities have achieved rapid growth, while
other provinces and cities have diverged. In the first half of the year,
Beijing (increased by 32.1%), Guangdong (increased by 6.2%), Shanghai
(increased by 56.4%), Zhejiang (increased by 26.1%) and Fujian (increased by
26.4%), which ranked the top 5 in cumulative Internet business revenue,
completed Internet business. Revenue was 554.9 billion yuan, an increase of 27%
year-on-year, and the growth rate exceeded the national average by 1.4
percentage points, accounting for 85.4% of the country (excluding
cross-regional enterprises). There are 23 provinces and cities that have
achieved positive growth in Internet business revenue growth, an increase of 1
from the previous month. Among them, 6 provinces and cities including Shanghai,
Guizhou, Hainan, Yunnan, Tibet, and Liaoning have increased by more than 50%.
Shanxi and Inner Mongolia have achieved positive growth. The province fell by
more than 30%.
4. The growth of the number of mobile applications (APP)
in my country
The number of mobile applications (APP) rebounded slightly.
As of the end of June, the number of apps monitored on the domestic market in
my country was 3.02 million, a net increase of 20,000 over the previous month.
Among them, the number of apps in the local third-party app store was 1.66
million, and the number of apps in the Apple Store (China) was 1.36 million. In
June, 160,000 apps were added to the shelves and 140,000 apps were removed.
The number of game applications has stopped falling and
rebounded, and the scale has maintained a leading position. As of the end of
June, the number of apps with the top 4 mobile applications accounted for
58.2%, and 10 types of apps such as other life services and education accounted
for 41.8%. Among them, the number of game apps continued to lead, reaching
729,000, a net increase of 10,000 from the previous month, accounting for 24.1%
of all apps. The number of daily tools, e-commerce and social communication
apps reached 465,000, 295,000 and 271,000 respectively, ranking second to
fourth in the scale of mobile applications, accounting for 15.4%, 9.8% and 9.0%
of all apps, respectively.
The total distribution of game applications ranks first. As
of the end of June, my country's third-party application stores have
distributed 1,867.4 billion applications on shelves. Among them, game downloads
ranked first, with 283.7 billion downloads; daily tools, social communication,
music and video, and life services were 259.3 billion, 243.4 billion, 197.8
billion, and 172.3 billion respectively. Ranked second to fifth. The downloads
of news reading reached 144.3 billion, the downloads of system tools reached
134.7 billion, and the downloads of e-commerce reached 117.5 billion. Among
them, the downloads of e-commerce and news reading increased more than last
month. Among the other types of applications, the applications that have been
downloaded more than 50 billion times include finance (93 billion times),
education (83.3 billion times), and photography (68.6 billion times).