Performance Indicators | CPU Overshooting Practice

Problem Discovery
We launched a new application some time ago. Due to the low traffic, the query rate per second (QPS) of the cluster was only about 5. The response time of the interface was about 30 milliseconds.
We recently connected to a new business. The data provided by the business side showed that the daily QPS is expected to reach 2,000, and the peak QPS may reach 10,000 during the promotion period.
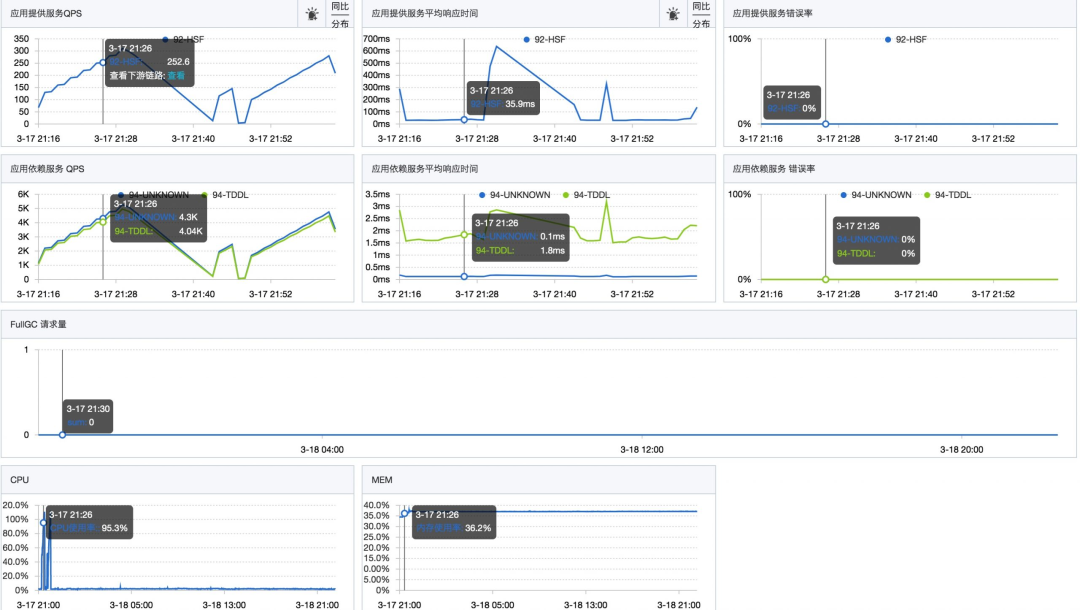
In order to evaluate the performance level of the system, we conducted a stress test in the pre-release environment. During the stress test, we observed that when the QPS of a single server reached about 200, the response time of the interface did not change significantly, but the CPU utilization increased rapidly until it reached the limit.
 picture
After the stress test ended, CPU utilization dropped immediately.
We then started to investigate what caused the sudden spike in CPU.
Troubleshooting and Solutions
During the stress test, after logging into the machine, we started troubleshooting the problem.
The troubleshooting process of this case uses Alibaba's open source Arthas tool. If you don't have Arthas, you can also use the commands that come with JDK for troubleshooting.
Before starting specific troubleshooting, you can first check the CPU usage. The easiest way is to use the top command to view it directly:
top - 10:32:38 up 11 days, 17:56,  0 users,  load average: 0.84, 0.33, 0.18
Tasks:  23 total,   1 running,  21 sleeping,   0 stopped,   1 zombie
%Cpu(s): 95.5 us,  2.2 sy,  0.0 ni, 76.3 id,  0.0 wa,  0.0 hi,  0.0 si,  6.1 st
KiB Mem :  8388608 total,  4378768 free,  3605932 used,   403908 buff/cache
KiB Swap:        0 total,        0 free,        0 used.  4378768 avail Mem
   PID USER      PR  NI    VIRT    RES    SHR S  %CPU %MEM     TIME+ COMMAND
   3480 admin     20   0 7565624   2.9g   8976 S  241.2 35.8 649:07.23 java
   1502 root      20   0  401768  40228   9084 S   1.0  0.5  39:21.65 ilogtail
   181964 root      20   0 3756408 104392   8464 S   0.7  1.2   0:39.38 java
   496 root      20   0 2344224  14108   4396 S   0.3  0.2  52:22.25 staragentd
   1400 admin     20   0 2176952 229156   5940 S   0.3  2.7  31:13.13 java
   235514 root      39  19 2204632  15704   6844 S   0.3  0.2  55:34.43 argusagent
236226 root 20 0 55836 9304 6888 S 0.3 0.1 12:01.91 systemd-journ- 1.
- 2.
- 3.
- 4.
- 5.
- 6.
- 7.
- 8.
- 9.
- 10.
- 11.
- 12.
- 13.
It can be clearly seen that the Java process with process ID 3480 occupies a high CPU, which can be preliminarily inferred that a large amount of CPU resources are consumed during the execution of the application code. Next, we need to further investigate which thread and which code caused this situation.
First, we need to download the Arthas tool:
curl -L https://arthas.aliyun.com/install.sh | sh- 1.
start up:
./as.sh- 1.
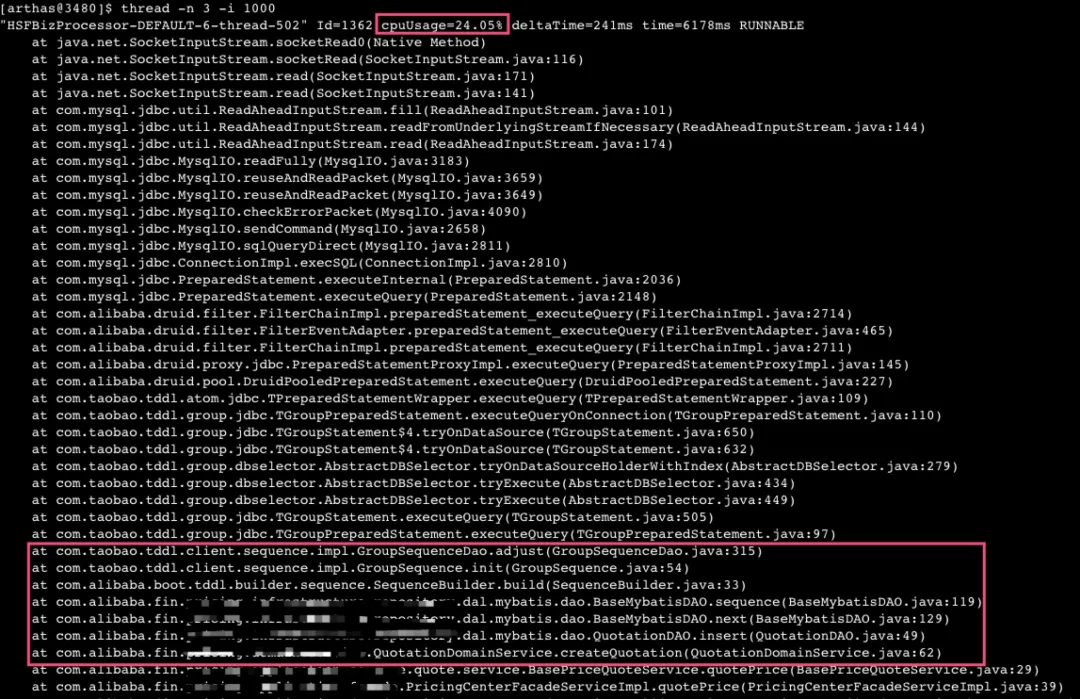
Use the Arthas command "thread -n 3 -i 1000" to view the three "busiest" (CPU-consuming) threads:
 picture
From the above stack information, we can see that the threads occupying CPU resources are mainly blocked on the TCP socket reading at the bottom layer of JDBC. After multiple consecutive analysis, we found that many threads are stuck at this place.
After further analysis of the call chain, I found that the problem originated from the database insert operation in my code, in which TDDL was used to create a sequence. During the sequence creation process, it is necessary to interact with the database.
According to our understanding of TDDL, each time it queries a sequence from the database, it will obtain 1,000 sequences by default and cache them locally. It will not obtain the next 1,000 sequences from the database until these 1,000 sequences are used up.
Considering that our stress test QPS is only about 300, it should not cause such frequent database interactions. However, by using Arthas to check multiple times, it is found that most of the CPU resources are consumed here.
Therefore, we started to investigate the code problem. Finally, we found a very simple problem, that is, there was an obvious flaw in our sequence creation and use:
public Long insert(T dataObject) {

    if (dataObject.getId() == null) {
        Long id = next();
        dataObject.setId(id);
    }

    if (sqlSession.insert(getNamespace() + ".insert", dataObject) > 0) {
        return dataObject.getId();
    } else {
        return null;
    }
}

public Sequence sequence() {
    return SequenceBuilder.create()
        .name(getTableName())
        .sequenceDao(sequenceDao)
        .build();
}

/**
 * 获取下一个主键ID
 *
 * @return
 */
protected Long next() {
    try {
        return sequence().nextValue();
    } catch (SequenceException e) {
        throw new RuntimeException(e);
    }
}- 1.
- 2.
- 3.
- 4.
- 5.
- 6.
- 7.
- 8.
- 9.
- 10.
- 11.
- 12.
- 13.
- 14.
- 15.
- 16.
- 17.
- 18.
- 19.
- 20.
- 21.
- 22.
- 23.
- 24.
- 25.
- 26.
- 27.
- 28.
- 29.
- 30.
- 31.
- 32.
- 33.
Therefore, each time we execute an insert statement, we rebuild a new sequence object, which causes the local cache to be cleared. Therefore, each time we need to re-obtain 1,000 sequences from the database, but in fact only one is used, and the process will be repeated next time.
To solve this problem, we adjusted the code and initialized a Sequence instance when the application started. In this way, when obtaining a sequence later, it will not interact with the database every time. Instead, it will first check the local cache, and only interact with the database again to obtain a new sequence when the local cache is exhausted.
public abstract class BaseMybatisDAO implements InitializingBean {
        @Override
        public void afterPropertiesSet() throws Exception {
            sequence = SequenceBuilder.create().name(getTableName()).sequenceDao(sequenceDao).build();
        }
}- 1.
- 2.
- 3.
- 4.
- 5.
- 6.
By implementing the InitializingBean interface and overriding the afterPropertiesSet() method, the Sequence is initialized in this method.
After completing the above code modification, submit and verify. According to the monitoring data, the read response time (RT) of the optimized database is significantly reduced.
 picture
The QPS of sequence write operations also dropped significantly:
 picture
So we started a new round of stress testing, but found that the CPU usage was still very high and the QPS of the stress test still could not meet expectations. Therefore, we decided to use the Arthas tool again to check the status of the threads.
 picture
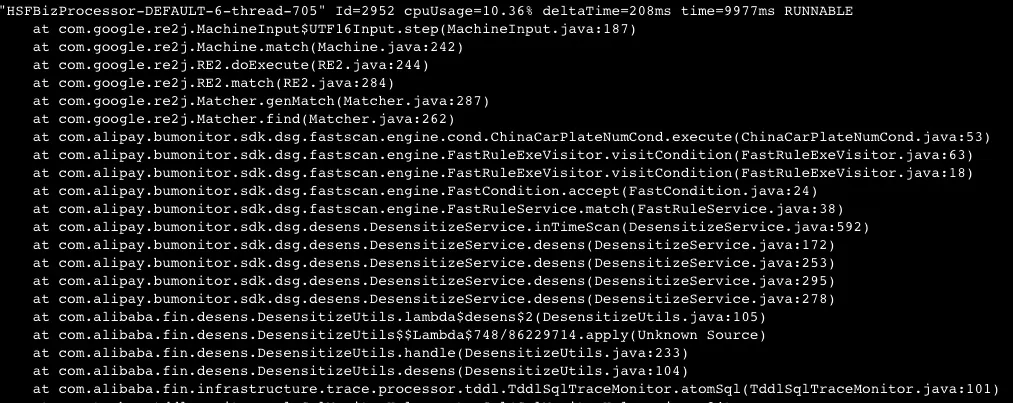
A thread stack with high CPU consumption was found. This was mainly because when we were using a joint debugging tool, TDDL log collection was enabled by default in the pre-release state of the tool (although the official documentation describes that TDDL collection is not enabled by default in the pre-release state, it is actually collected).
When the tool prints logs, it will perform data desensitization. The desensitization framework uses Google's re2j for regular expression matching.
Because my operation involves a large number of TDDL operations, and by default, a large number of TDDL logs are collected and anonymized, which leads to high CPU consumption.
Therefore, this problem can be effectively solved by disabling TDDL log collection in the pre-release environment.
Summarize
This summary reviews the process of troubleshooting an online CPU spike problem. Although the problem was not complicated to solve in the end, the troubleshooting process had its unique educational significance.
As an experienced person, I conducted routine investigations and did not find any obvious problems in the initial stage. I mistakenly attributed the increase in database operations to a normal situation caused by increased traffic.
Through multiple verifications (such as using arthas to check the sequence acquisition status and querying the primary key ID of the latest inserted data through the database, etc.), it was finally confirmed that the problem lies in the sequence initialization mechanism of TDDL.