Kuaishou BI big data analysis scenario performance optimization practice

KwaiBI product is a data analysis product currently used internally by Kuaishou. The platform vision is: to create a one-stop data analysis platform through enriching analysis tool products to improve the efficiency of data acquisition and analysis. KwaiBI currently has a monthly activity of 1.5W, supports more than 5W reports, more than 10W models, and access to more than 150 large and small businesses.
KwaiBI provides 5 data consumption scenarios, including data retrieval, multi-dimensional analysis, visualization, push, and portal. The main analysis scenarios are multidimensional analysis and visualization.
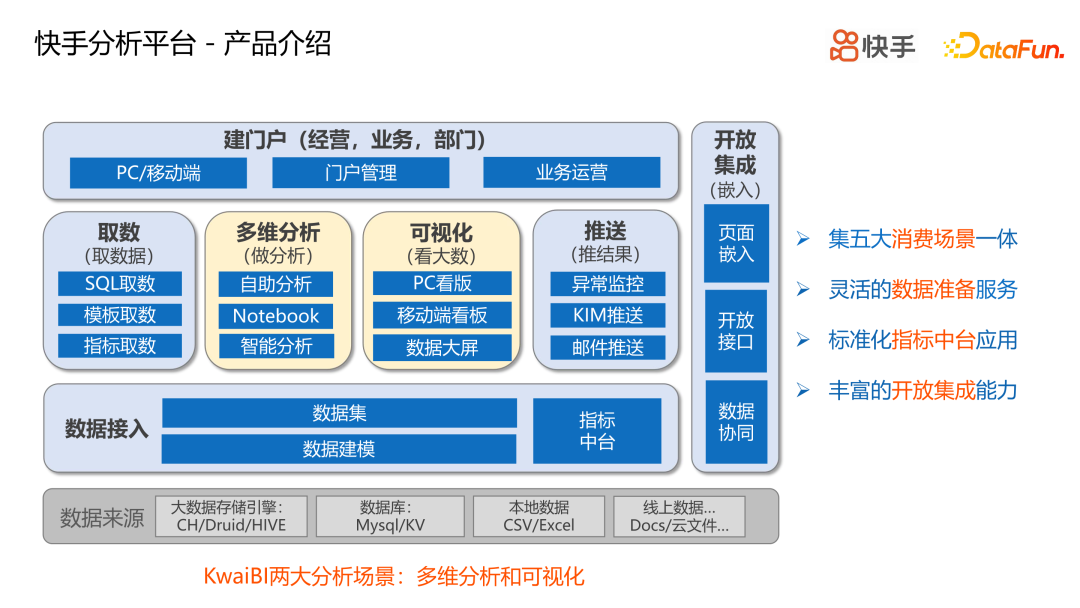
1. Introduction to the analysis capabilities of Kuaishou analysis platform
The bottom layer of the Kuaishou analysis platform is connected to a variety of data sources, including various big data storage engines and traditional relational databases. It also supports data analysis of some local files.
Before using the KwaiBI analysis platform for data analysis, users need to connect the above data sources to the analysis platform. Data access is usually completed by the data content builder (DE/DPM), who performs data modeling on the data source, that is, constructs the relationship between tables, and obtains the corresponding data model through data modeling. On, build a data set (a data set is usually a business domain or a collection of business topics). During the data access process, if the standardized indicator dimensions are standardized, the indicators/dimensions will be standardized and managed through the indicator middle platform, and then directly connected to the analysis platform.
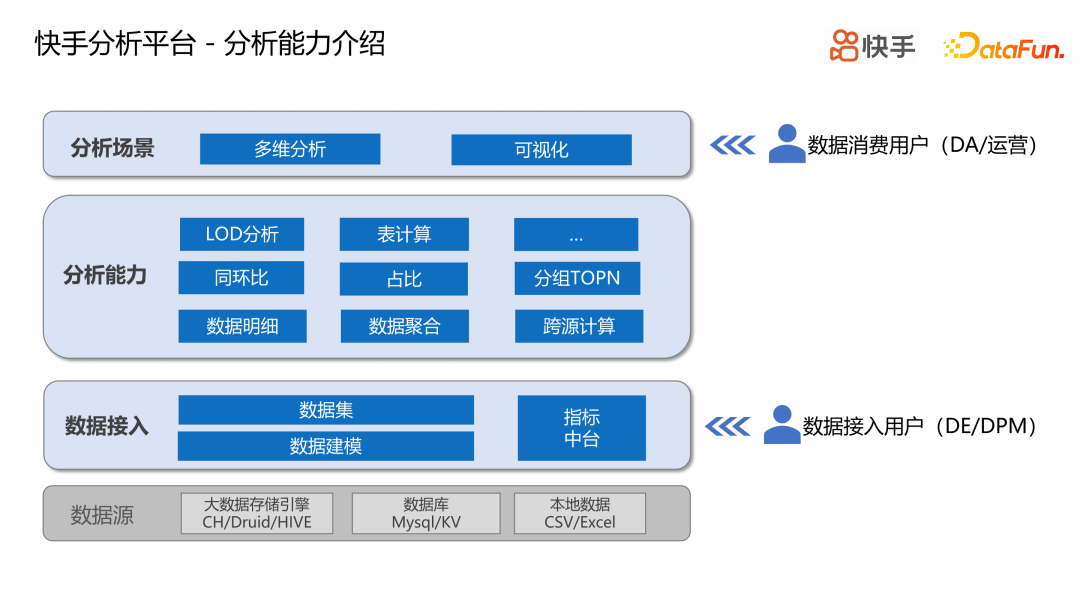
After the data is accessed, the analysis platform provides a series of analysis capabilities, such as basic data analysis capabilities (data details, data aggregation, cross-source calculation). On top of the basic analysis, some complex analyzes can be done, such as chain comparison and proportion. , LOD analysis, table calculation, etc. Based on these powerful analysis capabilities, the end consumer users of data (DA/Operations) can use these capabilities for analysis through multi-dimensional analysis and visualization.
2. Kuaishou analyzes scene performance challenges
Kuaishou big data analysis platform, as a data output platform, the challenges faced by users mainly include:
- Performance analysis is difficult: it is not clear which link consumes time, and the platform is a black box for users; the query characteristics of data consuming users are not understood; performance fluctuations are difficult to attribute.
- The threshold for optimization is high: it requires a strong knowledge background and strong professional expertise, and analytical users are usually novice users who are unable to analyze and optimize by themselves.
On the platform side, there are also some challenges:
- High analysis complexity: more than 30% of complex analyses, including year-on-year comparison, proportion, LOD analysis, etc.;
- The engine query complexity is high: there are many related queries, a large amount of data, and a large query time range;
- Engine limitations: The current main engine of Kuaishou is ClickHouse, which is not friendly to related queries and SQL optimization is not smart. (Each engine has its own limitations)
3. Kuaishou analysis scene performance optimization practice
(1) Play strategy
In response to the difficult problem of performance analysis, the analysis platform buries points across the entire link to learn which link the performance consumes. Based on these buried points, the platform can perform query profile analysis on users to understand what indicators users are analyzing, what dimensions they are analyzing, and the time range of analysis. With the user profile information, we can further build an autonomous data set performance diagnosis and analysis tool to conduct open self-service performance analysis.
For problems with high optimization thresholds, the analysis platform will automatically optimize queries, including cache preheating, materialization acceleration, query optimization and other means. In addition, based on existing user query profiles, data consumption can be used to drive data content and perform related optimizations.
The overall idea is mainly divided into four steps, namely determining the goal, confirming the team (participants), performance analysis (analyzing performance reasons in different scenarios), formulating solutions and implementing them.
(2) Determine goals
The goal of analysis performance is to evaluate the performance of the analysis platform from the perspective of users who consume the data on the analysis platform. It is mainly abstracted into three performance North Star indicators: average query time, P90 query time, and query success rate. For the three indicators, target values are determined based on scenarios. For example, in the visual billboard scenario, most of the important data is accumulated, and some important people are watching it, so the performance guarantee requirements are relatively higher; in the multi-dimensional analysis scenario, it is more autonomous and flexible for daily operations. This Performance targets can be set relatively loosely.
In general, performance goals do not have an absolute value and need to be achieved based on the company's business scenarios and the analysis needs of each business team. Use indicators as traction to continuously track the effects of performance optimization.
(3) Confirm the team
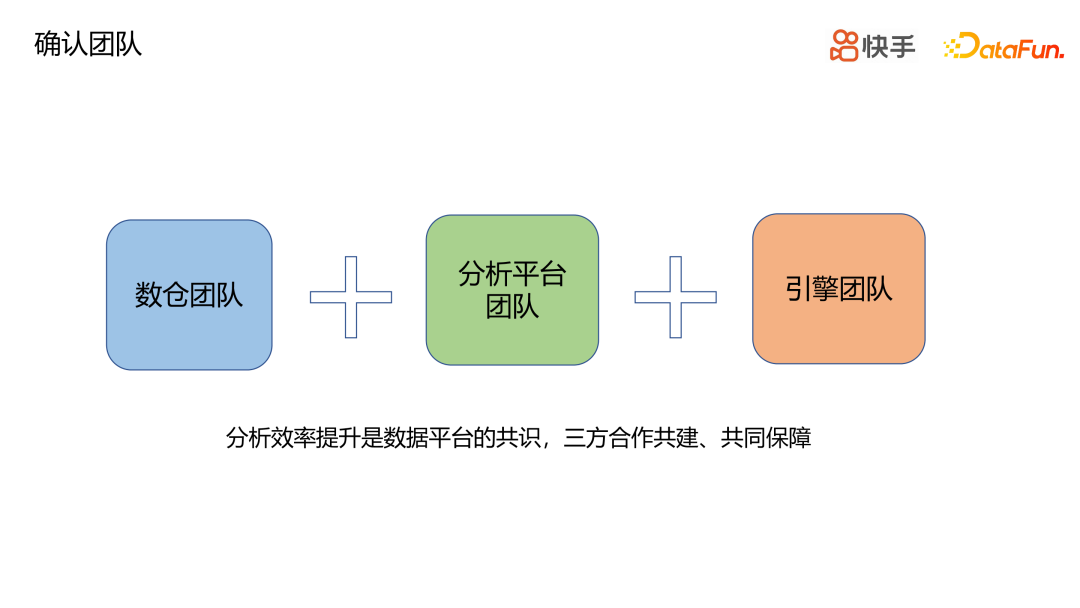
The improvement of analysis performance is not limited to the analysis platform. Performance optimization requires the cooperation and joint construction and guarantee of the analysis platform team, data warehouse team and engine team. A complete analysis link includes engine query and secondary analysis and calculation of the analysis platform, and its influencing factors are multi-factor. If we only work from the analysis platform itself, we can only do a good job in optimizing the internal analysis platform. However, the improvement of the quality of some data content construction and the optimization of engine-level calculations require cooperation among three parties.
(4) Performance analysis
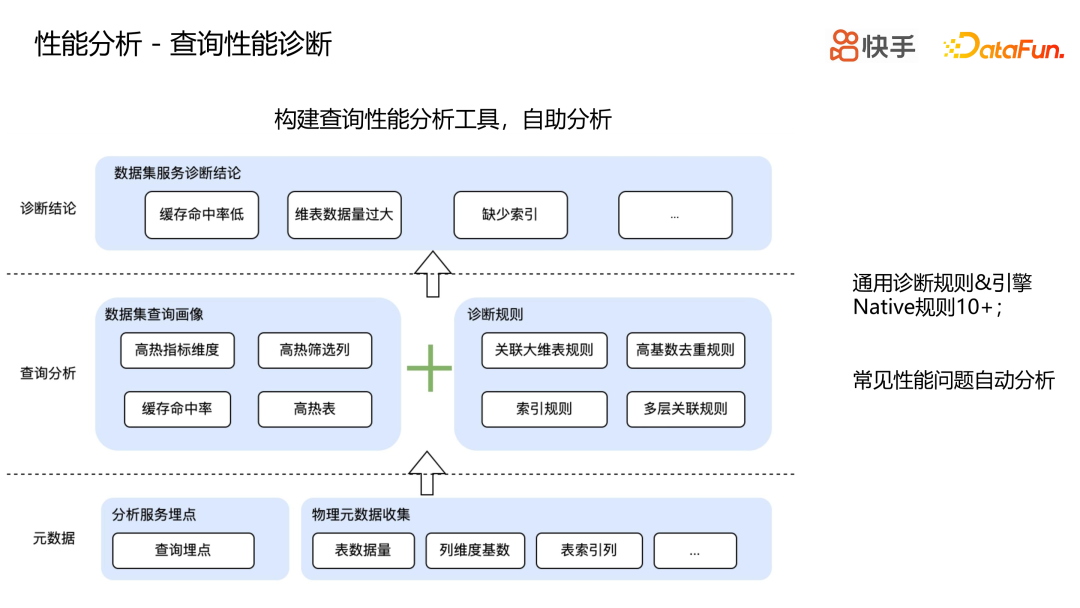
To optimize performance, we must first identify the root causes of performance degradation and then prescribe the right medicine. The platform side hopes to help users conduct self-service analysis by accumulating general query performance analysis tools. The prerequisite for self-service analysis is sufficient metadata. There are two main types of metadata. One is the burying point of the analysis service, and the other is the collection of some physical metadata.
Combining the two types of metadata, the query portrait data of the data set can be constructed. In this way, you can know which hot indicator dimensions users are looking at, which hot tables are used, and which time range data are usually queried. You can also see some of the analysis platform's own indicators, such as cache hit rate and other internal queries. Time-consuming, these can all be analyzed based on metadata. In addition, there are also some diagnostic rule collections. These diagnostic rules are mainly rules that are not friendly to query performance. Based on the portrait and rules, a diagnostic conclusion is finally obtained: what data problems may exist in the data set and what room for optimization is there. Common performance issues can be self-analyzed based on analysis tools.
(5)Solution
Based on the conclusions of the performance analysis, the analysis platform developed a systematic solution to promote the joint construction of the three teams to achieve optimization goals. The analysis platform itself optimizes the performance of the platform through various means such as cache preheating, materialization acceleration, query optimization, etc. to optimize the performance of the analysis platform. The analysis platform provides performance diagnosis of the data set for the data warehouse, directly exposes possible problems in the data set to the data warehouse team, and performs targeted data construction and optimization based on the corresponding problems. For example, some hot queries can be aggregated and indexed. , do data hashing, etc.
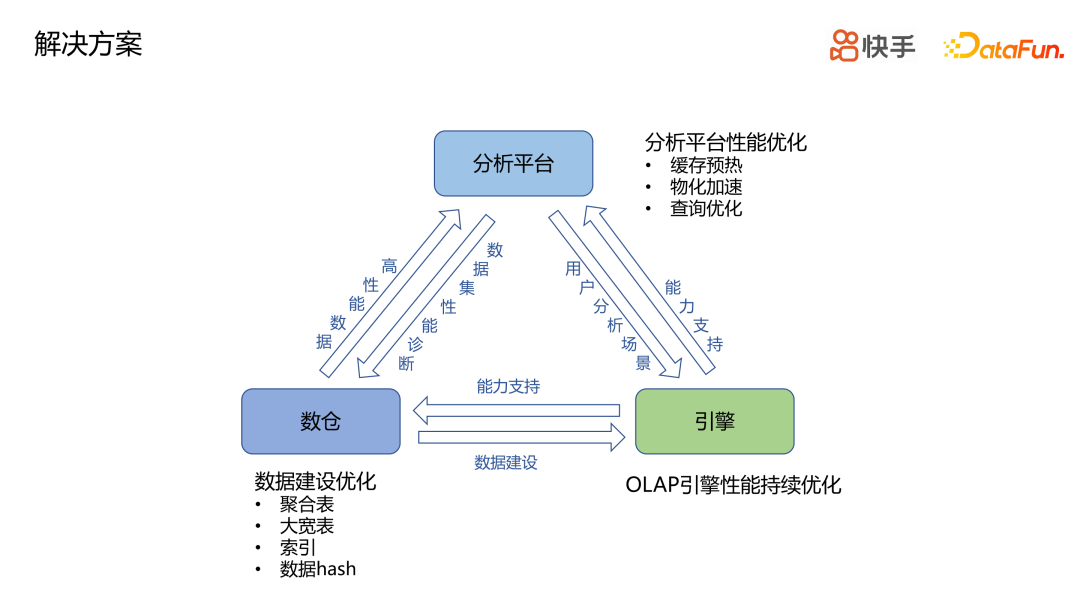
Some high-quality data produced by the data warehouse will also be connected to the data platform, which will be reflected in the improvement of performance and quality for users. The engine team will provide engine capability support for the analysis platform and data warehouse, and will also perform continuous performance optimization.
The following focuses on some optimization strategies on the analysis platform side:
Analysis platform performance optimization-cache warm-up
For some fixed number-viewing scenarios, such as Kanban scenarios, put the Kanban data or chart queries in the cache in advance. When the user uses it, the data is fetched directly from the cache. In this way, no matter how large the data volume of the original query is, the performance of directly reading the cache is improved. It must be very efficient.
The construction of cache preheating capability mainly consists of four parts, preheating trigger, preheating calculator, preheating actuator, and preheating monitoring.
The preheating trigger determines when cache preheating is needed. For example, scheduled scheduling can warm up the cache in advance during peak user usage periods. In addition, while accelerating data, data quality must also be ensured.
The warm-up calculator calculates which historical queries and charts are worthy of warm-up and valuable. By observing the lineage of the data set, we can know whether the data was produced offline or in real time. Obviously, the data produced in real time is not suitable for preheating. In addition, warm up some fixed and high-heat charts. Finally, it is calculated which charts or user historical queries you want to preheat.
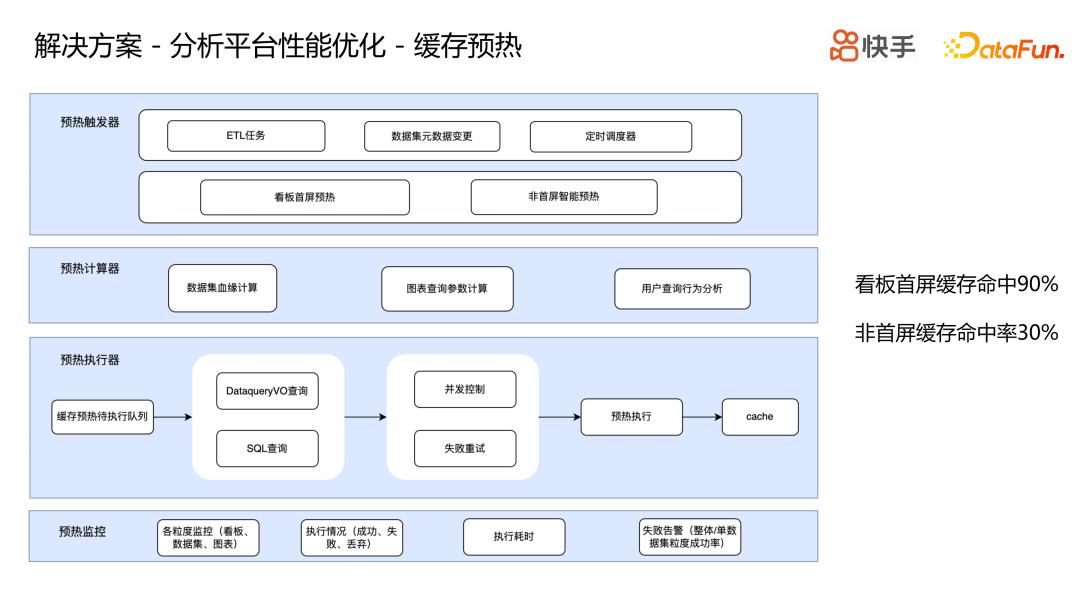
Because the preheating amount of the preheating executor may be large, considering the service load, some concurrency control must be added, and finally the preheated data is placed in the cache.
Finally, there is the monitoring of preheating, which monitors the execution of cache preheating, the execution time, and the cache hit rate of cache preheating. After cache preheating and construction, the first-screen hit rate of the visual billboard scene can reach 90%, and the cache hit rate of non-first-screen displays has reached 30%.
Analysis platform performance optimization-query optimization
Query optimization will first be based on Kuaishou's open analysis expression OAX (Kuaishou's unified analysis language for analysis scenarios, all the above analysis scenarios are built based on OAX). That is, the user's final data analysis is abstracted into OAX language, and the OAX language is parsed to know what advanced calculations the user has and which ones are model-based or physical table-based calculations, and then some basic analysis and orchestration will be performed.
Then perform AST optimization. The leaf nodes of AST read data from the engine, but for analysis platforms, some are table-oriented and some are model-oriented (building models based on the relationship between tables). A data set can have multiple models, and an indicator can be supported in multiple models. The model search will be optimized to ensure that the selected table or model has accurate data, and at the same time ensure that the data acquisition efficiency of the selected model is optimal. Obtain a model that is both accurate and efficient.
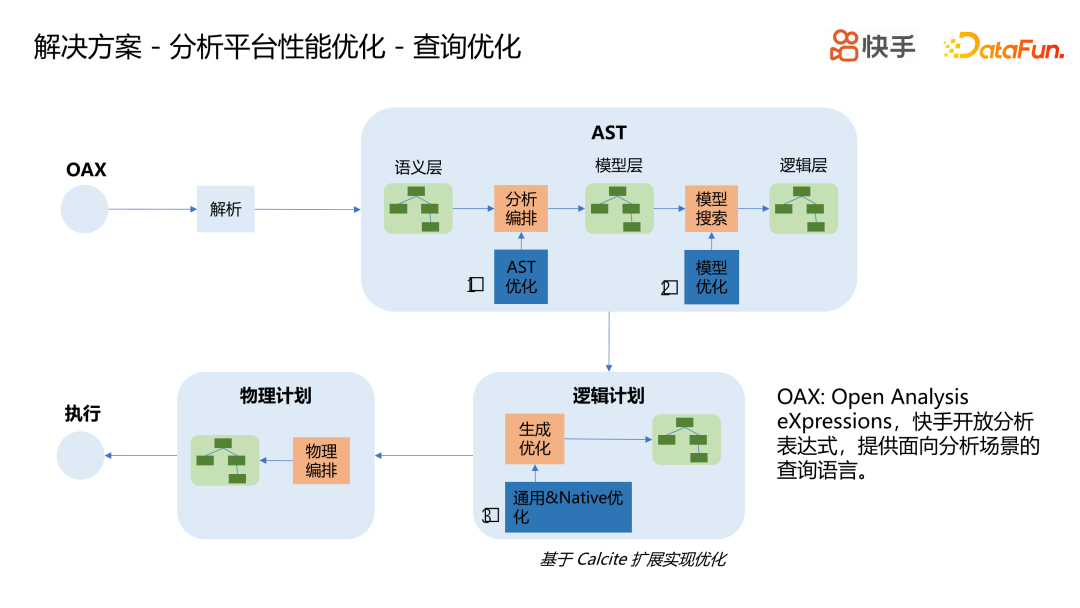
After having the model, the model will be translated into the engine's query language, and some general or Native SQL optimization will be done during the translation.
When the leaf nodes are also engine-oriented SQL, the AST can be truly physically orchestrated and can be executed after physical orchestration.
During the query optimization process, Kuaishou has accumulated more than 50 general & Native optimization rules, including:
- Complex analysis query push-down: Try to convert these complex analyzes such as proportion or same-month comparison into a complete SQL push-down execution;
- predicate pushdown;
- Aggregation operator optimization;
- JOIN order adjustment.
Analysis platform performance optimization-physical acceleration
Materialization acceleration is to build a final result table and directly produce the data calculation process into the result table through ETL production.
Kuaishou materialization acceleration currently uses the method of generating production tasks for data production, rather than utilizing the materialization capabilities of the OLAP engine. Faced with different application scenarios, there are different performance goals, and the selection of historical queries is also different.
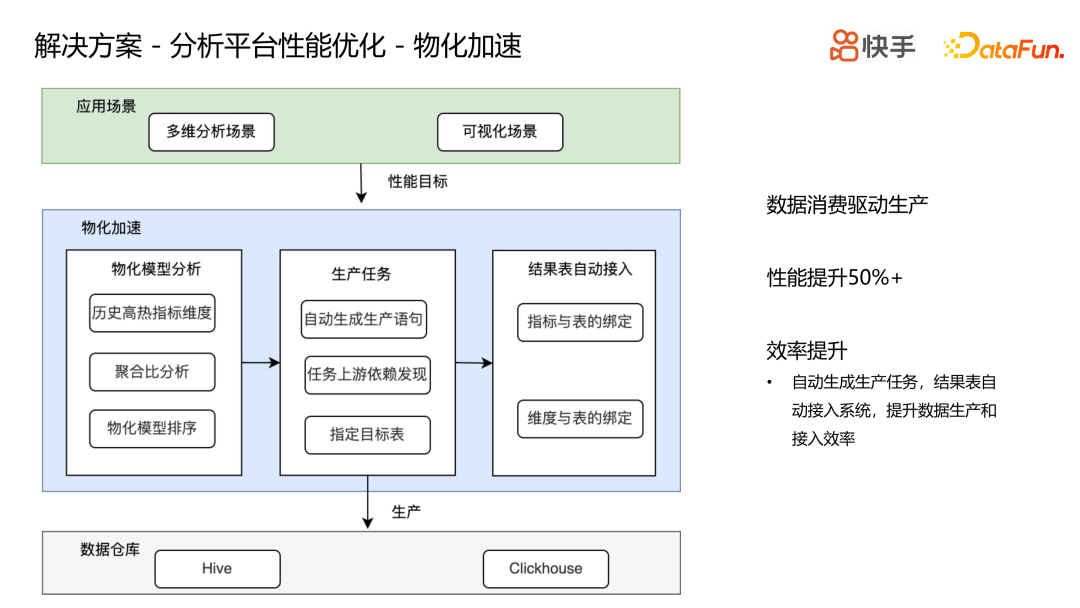
The materialization acceleration process starts with materialization model analysis, which abstracts the indicator dimensions of user historical queries into an indicator dimension model, finds out the combination of indicator dimensions that exceed the performance target, and analyzes its aggregation ratio (number of aggregated data rows and original rows The lower the aggregation ratio, the fewer the number of rows after aggregation, and the better the final query effect.) Next, sort all these high-heat index dimension materialized models, take into account the historical number of queries and time-consuming of the materialized models, and select one or several models with relatively high returns for materialized accelerated production.
After having the target model that requires materialization acceleration, the production task will be automatically generated, and then the production task will be produced, and the final data will fall to Hive or ClickHouse. The produced result table will eventually be automatically connected to the analysis platform, and the result table will be bound to the indicators.
This is a scenario where data consumption drives production. Know what the data terminal consumes, and then do data production. The performance of the average result table will be improved by 50%. It will also bring efficiency improvements, because automatically generated production tasks and result tables will also be automatically connected to the system, improving data production and access efficiency.
(6) Engine performance optimization-Lake warehouse integrated OLAP engine Bleem
In terms of engine-level optimization, Kuaishou's strategy is to build a unified lake-warehouse integrated analysis engine Bleem, and then support high-performance engine computing capabilities in Bleem. Its main capacity building includes the following points:
First of all, in terms of caching, different levels of caching are built, including metadata caching, data caching, and index data caching. Secondly, in terms of operator execution, there are vectorization, multi-threading, and distribution. And materialized views, optimizers (RBO&CBO optimizer, optimization for JOIN).
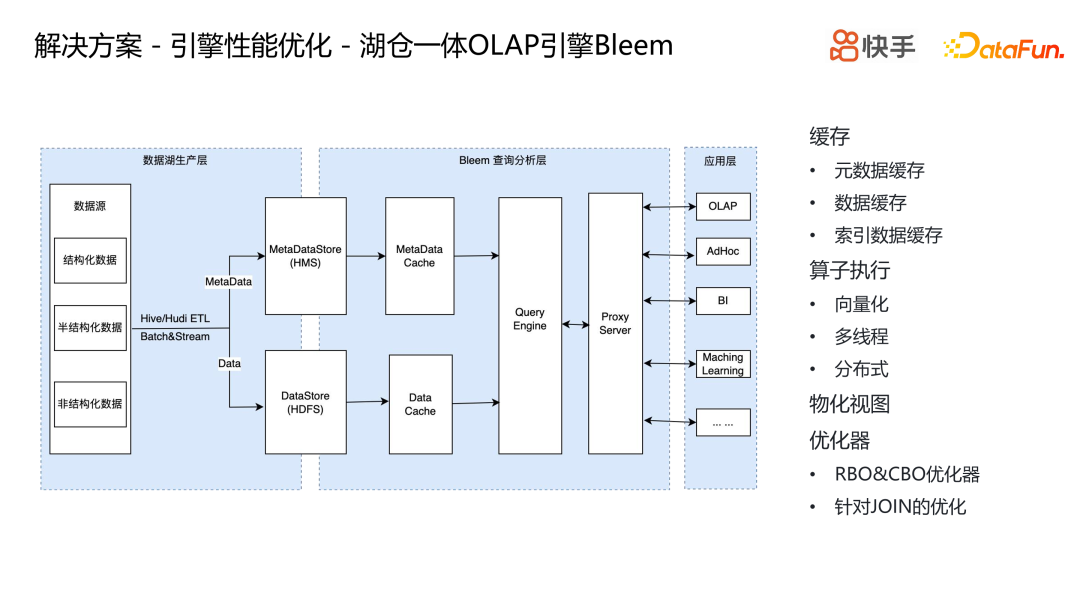
Bleem is the Hucang integrated engine that Kuaishou is promoting and using. It is not positioned to replace ClickHouse, which already meets many needs. Bleem, the integrated lake and warehouse engine, will optimize some pain points of ClickHouse, such as join optimization and RBO&CBO optimization. In addition, Bleem directly faces the data lake, and its main purpose is to improve the analysis efficiency of the data lake. The ultimate goal is to achieve performance close to ClickHouse. In this way, data analysis can be performed directly from the data lake, avoiding some consumption of data production.
4. Future prospects
The above introduces the performance optimization practice of analysis scenarios. To sum up, performance optimization requires team collaboration to achieve efficient user-oriented analysis, such as analysis and diagnosis, query optimization, materialization acceleration, cache preheating, data warehouse construction, engine optimization, etc. Regarding the future development direction, an eternal topic in data analysis is the ultimate analysis performance. In the future, optimization must be achieved through a combination of software and hardware. The ultimate vision goal is to be able to automate/intelligent the entire link from problem discovery, analysis, and optimization, thereby reducing human investment and providing efficient data analysis.
5. Q&A session
Q1: Does Bleem have any development plans to cooperate with the community, such as open source?
A1: I understand that it is not available yet. This is still in the process of continuous optimization and iteration.
Q2: Which level does Bleem belong to in the ecosystem?
A2: An analytics engine for the data lake.
Q3: Can materialization optimization optimize cross-table JOIN?
A3: Yes. There are two modes of materialization, one is aggregation mode and the other is full mode, mainly optimizing JOIN.