OSSIM platform network log correlation analysis actual combat

This paper mainly conducts an in-depth analysis of the log correlation technology implemented by OSSIM.
1. Challenges faced in network security management
At present, many organizations already have firewalls, intrusion detection systems, antivirus systems, and network management software. However, network managers face the following challenges in security traceability and security management:
1. The number of security events generated by security equipment and network applications is huge, and false positives are serious. An IDS system generates nearly tens of thousands of security incidents a day. Typically 99% of security incidents are false positives. Really threatening security incidents are drowned in massive information and are difficult to identify.
2. The relationship between the horizontal and vertical aspects (such as different spatial sources, time series, etc.) between security events has not been comprehensively analyzed, so the underreporting is serious and real-time prediction cannot be achieved. An attack activity is often followed by another attack activity, and the former attack activity provides the basic conditions for the latter; an attack activity generates security events on multiple security devices; multiple security events from different sources are actually a coordinated attack, these There is a lack of effective comprehensive analysis.
3. Security managers lack the ability to perceive the entire network security situation in real time. Security devices operate independently, and the huge logs generated by the devices are redundant, independent and scattered, and it is difficult to distinguish the true from the false. Obviously, it cannot be directly used as the basis for security incident response.
The following is an example of a medium-sized enterprise with 500 computers, the number of incidents generated by network security products every day, as shown in Table 1.
Table 1 Analysis of typical enterprise log output
safety goal | safety product | Log Yield (/day) |
Intranet security | desktop management system | more than 1000 |
Antivirus system | Antivirus server, antivirus network management | 50000 |
cyber security | switches, routers | more than 1000 |
IDS/IPS | more than 500000 | |
Firewall, bastion machine | More than 2000000 | |
Protect critical business | Host audit, application audit | more than 100,000 |
It is not difficult for us to collect these logs through the existing log collection technology. However, it is difficult for security personnel to identify the internal clues between a large number of security events in a short period of time, and it is even more difficult to analyze the correlation of logs. At this time, we need a technology that can help us to automatically get network anomaly alarms after processing and analyzing massive log data, so as to improve the efficiency of the security team in discovering network threats.
2. Network correlation analysis technology
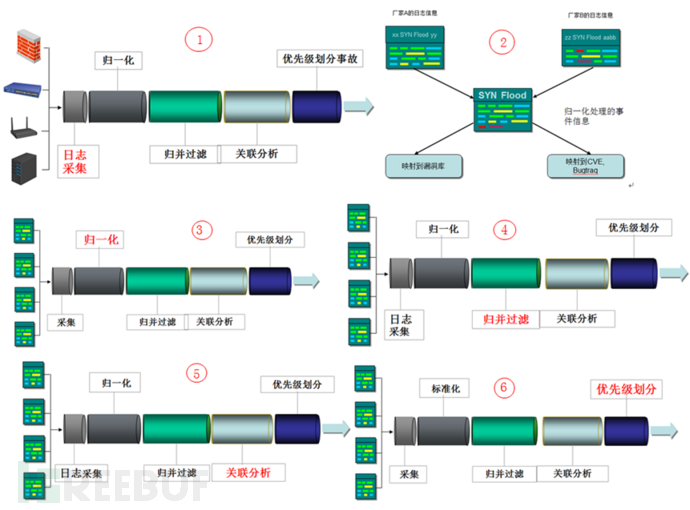
In the face of the above problems, we can solve the problem by correlating the analysis platform. This platform can provide us with an overview of all aspects of network security. It also provides real-time monitoring and event correlation, risk analysis, reporting, and notification functions. Comprehensively manage and audit security affairs within the system, greatly improving the ability to identify network security risks. The correlation analysis platform relies on the core technology of correlation analysis and focuses on three aspects: log collection, log formatting (also called normalization), and log correlation analysis.
1. Log collection: Whether a SIM product has advantages depends on log collection, whether it can support more types, whether it can be easily expanded, and automatically identify and support unknown device logs. For example, the protocols that need to be supported include syslog, snmp trap, windows log, database, file, xml, soap, etc.
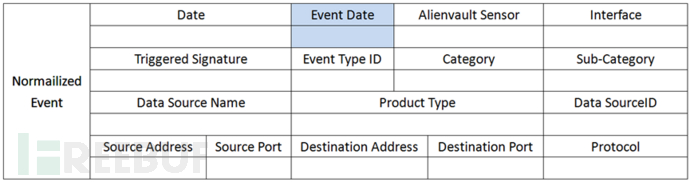
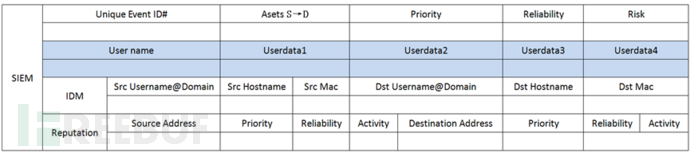
2. Log formatting: After the logs are collected, unified standards need to be formatted. These unified formats will add labels such as risk value, reliability, and priority to the original logs to prepare for subsequent correlation analysis. If the formatting is not standard enough , the association analysis cannot be achieved. The following is the normalized format:
The following is a before-and-after comparison of SSH original logs and standardized logs:
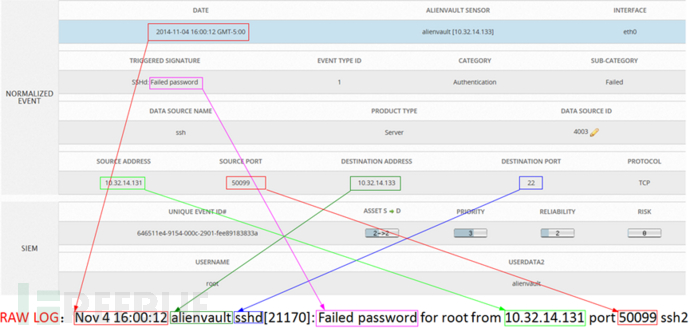
It can be seen that the SSH brute force attack event has many more elements than the original log, but these additions can prepare for future log correlation analysis.
3. Log correlation analysis
On the basis of log formatting, certain algorithms (context correlation, attack scenario correlation, etc.) are used to obtain events from multiple data sources for correlation analysis to realize the risk value of different logs, and combine the asset vulnerability information and inbound and outbound traffic to comprehensively calculate the network. Assets are threatened, and finally an alarm is issued to alert administrators. This greatly reduces the difficulty for administrators to analyze massive logs.
In order to achieve the purpose of correlation analysis of security events, it is necessary to have a good event processing mechanism, such as the normalization processing of log collection mentioned above, and a good correlation method, and there is more than one correlation method to correlate multiple real-time Combining the methods together works better. After a large number of standardized events are sent to the correlation engine for processing, they will undergo a variety of correlation methods such as event classification processing, aggregation, cross-correlation, and heuristic correlation. The system will perform statistical classification according to the security events in the database.
Let's look at a correlation analysis scenario:
(1) For example, the VPN server log shows that Zhang San logged in from the external network to the intranet at 3:00, logged in to the FTP server at 3:05, and downloaded a certain file on the FTP server. The log of the access control system shows that Zhang San has just entered the office area not long ago, and these three logs can be related to a security event.
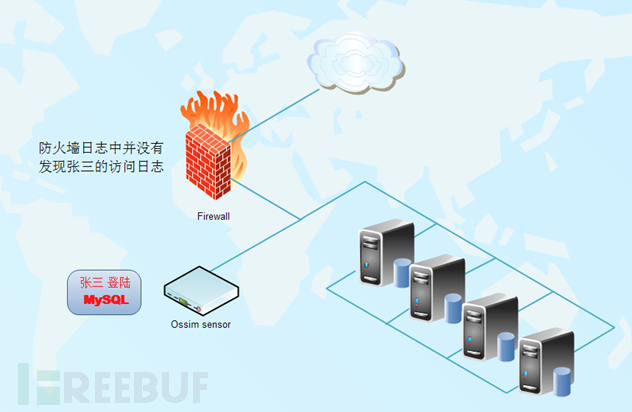
(2) A firewall system is deployed at the front end of the core database of a company. One day, the security system monitoring found that Zhang San logged into the MySQL database server, but Zhang San's access log was not found in the firewall log, which means that Zhang San is likely to bypass the The firewall directly logs on to the database server.
3). In the network, OpenVas scans a Linux host with an Apache 2.2.x Scoreboard (local security restriction bypass) vulnerability. At the same time, NIDS detects an attempted attack on the host's vulnerability. If the Linux server is marked with If the corresponding patch is applied, the correlation analysis result is a low risk value, and no alarm will be issued. If the patch is not applied, the audit system will alarm.
Each system management has its own security protection measures, but they are just security islands, but there must be a relationship between everything. Linking these logs together for analysis is the correlation analysis technology we introduced above.
4. OSSIM correlation engine
1. Overview of the correlation engine
The core of the correlation analysis technology implemented under the OSSIM platform is the correlation engine. After the OSSIM sensor sends a large number of standardized events to the correlation engine for processing, they will undergo a variety of correlation methods such as event classification processing, aggregation, cross-correlation, and heuristic correlation. The system will perform statistical classification according to the security events in the database, and find out the origin of security events and frequently attacked ports. Event alarms will be generated during these stages. The security event correlation process module is shown in the figure below.
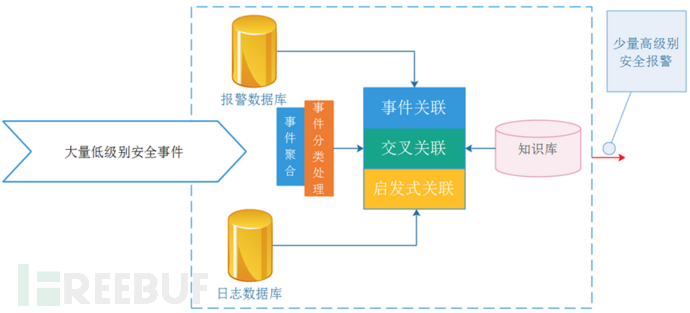
The event aggregation module in the management engine can provide high-quality security events for subsequent correlation and improve the efficiency of the correlation engine, and classification processing can directly upgrade known security events with high reliability and high attention to alarms. In addition, statistical classification generates the most frequently attacked hosts and applications in the controlled network segment by comprehensively analyzing the alarm database, log database, and knowledge base, and counts the number of security events with the same data source and the same target port. Objectively reflect network abnormalities.
In the OSSIM system, the correlation analysis function is also implemented by the correlation engine. The correlation engine policy file definition is located in /etc/ossim/server/, and the analyzed data is collected by the probe. The Sensor (sensor) is collected from the network every day. There are tens of thousands of events. It is meaningless to generate events directly without any processing of these massive event information. Before reporting, these thousands of events can be condensed (clustered) through correlation analysis, and confirmed into dozens or even several events, which are displayed in the SIEM of the web front end. A simple understanding is that OSSIM's network security event correlation analysis can remove false alarm information generated by open source network security detection tools with different functions, so as to dig out real network attack events.
2. Main keywords
The risk assessment in the OSSIM system mainly revolves around the threat of attack (Threat), vulnerability (Vulnerability), response (Response, security measures), assets (Asset) and so on. The risk assessment model is embedded in the OSSIM correlation engine system. The correlation engine combines the asset library, vulnerability library and threat library in the knowledge base to comprehensively consider the three elements of risk assets, vulnerabilities and threats.
3. Asset Risk Calculation
Risk=R(asset,vulnerability,threat)
Combining the three parameters of asset value (Asset), priority (Priority), and reliability (Reliability) together to calculate the risk is concise and effective. The following formula is used in the OSSIM system:
Risk=asset*priority*reliability/25 (risk model calculation formula 1)
Among them Asset (asset, value range 0~5)
Priority (priority, the value range is 0~5)
Reliability (reliability, the value range is 0~10)
The Risk value of each Alert event is calculated by formula (1), where
Ø The value range of Asset is 0 to 5, and the default value of asset is 2; in the OSSIM system, the attention level of assets is divided into 5 levels, and the values from low to high are 1, 2, 3, 4, and 5 respectively. On the surface, it is understood that the size of the number determines the size of the Risk value in the risk calculation formula, but it also has its deep meaning. For example, the asset level of an ordinary workstation is 1. When it is attacked by DOS, we only need a simple port network connection. If it is a database server, its asset level is 5, and the database service needs to be online in real time, so we cannot deal with the same DOS attack as a workstation, but should automatically enable an alternate IP address and direct the attack to the network honeypot system.
Ø The value range of Priority is 0~5, and the default value is 1. This parameter describes the degree of damage caused by a successful attack. The larger the value, the higher the degree of damage;
Ø Reliability or Reliability ranges from 0 to 10. The default value is 1. The reliability parameter describes the probability that an attack may succeed. The highest value is 10, which means 100% possibility. The more unreliable the representative is, the more likely it is to be attacked.
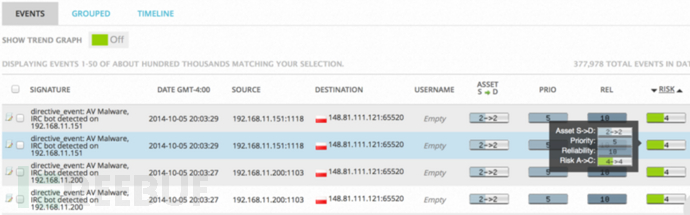
When you operate OSSIM, open the SIEM console in the Web UI, and observe each event, you can find that the risk value is controlled by the asset value priority and credibility. Each asset in the network is valuable, and the quantification of this value is realized by the asset value. The default value of each asset is 2 (range 1~5). It can be analyzed in the risk calculation formula that the risk calculation does not calculate the asset value. As the main factor affecting the risk results, for example, some database servers have high asset value, the calculated risk value will also be large, and those workstations with small asset value have a small risk value on nodes that are severely attacked, so it is difficult to It will lose its original authenticity, so let the range of asset value be between 1 and 5, and the risk value will be small.
Scenario example:
A host is connected to port 445 of 5 different IP addresses in a VLAN, this may be normal network communication, if 15 machines are connected to port 445 this is suspicious, if there are 150 such connections and it lasts for a long time , it is likely to be attacked by worms and needs to be further verified manually.
4. Relationship example of Risk & Priority & Reliability
According to the formula calculation, anyone can do it. What is the internal relationship between the various parameters in the above formula 1?
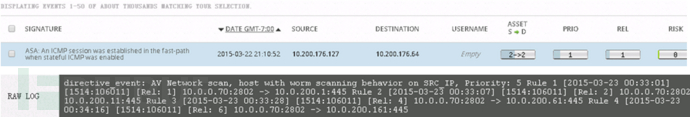
Among the events we have collected, repeated events account for a large proportion, among which risk is mainly Risk=0. For example, taking an ICMP event of Cisco ASA as an example, its PRIO=1, REL=1, ASET=2, according to the above The risk model calculation formula is calculated to be approximately equal to 0.
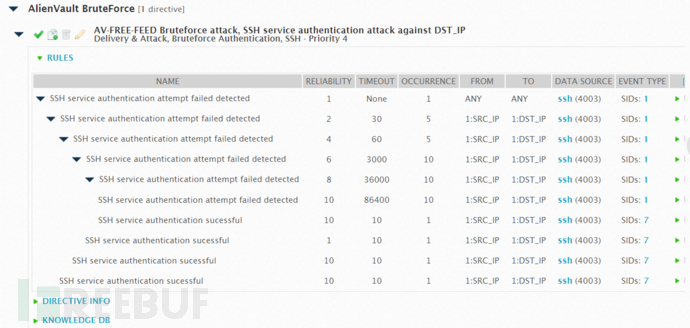
Analysis of the above figure shows that the Reliability system has set an initial value for it in the association rule. Imagine that if it is a constant, a large number of false positives will be generated in dynamic network attacks. Then, when the cross-correlation is introduced After the mechanism, the network security alarm is spatially correlated with the vulnerability information of specific network application services, open ports, and open ports to determine whether the attack can be achieved, so the reliability value must be a variable. The security event containing the port that cannot exist is directly discarded (there is a list of immediate updates in the KDB of the system). The following figure shows the change process of the reliability parameter in the OSSIM association rule.
5. Event Aggregation
We know that redundant alarms will seriously interfere with the administrator's judgment of faults. At this time, these information need to be aggregated. By aggregating some similar alarms from the massive alarms, the redundant parts are removed and the number of alarms is reduced. This greatly reduces the workload of the correlation module for correlation analysis.
Merging redundant alarm information is mainly considered from three aspects:
(1) Merge redundant alarm events generated by host-based monitoring Ossec.
(2) Merge redundant alarm events generated by network-based monitoring Snort/Suricata.
(3) Combine host monitoring Ossec and network monitoring Snort alarm information for the same attack.
The attributes of Snort alarm information are relatively comprehensive and have obvious characteristics. The process of merging alarm events generated by Snort can adopt the method based on attribute similarity. For the merging of Ossec's alarm events, OSSIM adopts a method based on the combination of event ID and alarm category information. At present, Ossec has more than 900 detection rules, all of which are stored in XML format. After statistical analysis, it can be classified into 80 alarm categories according to the alarm behavior. Common ones include: Syslog, Firewall, IDS, Web, Squid, Windows, etc. The event ID of the OSSEC alarm is used as the entry, so that the matching between the first-level classes and sub-classes is carried out to achieve the purpose of matching and merging.
According to the analysis of information sources, we see that the aggregated objects are the alarm data generated by network-based Snort/Suricata and host-based Ossec security products. Contains protocol attributes, which can be aggregated in a rule-based manner, and can ensure that the alarm information is correctly classified during the clustering process.
Snort supports multiple protocols, and it saves a lot of time by clustering alarm events and then merging them. And also because of the obvious characteristics of its attributes, the merging of redundant information is carried out based on the similarity of its attributes, so that the merging error is small. For the alarm information generated by Ossec, the ID of the alarm event is the entry, and it is gradually aggregated according to the alarm category, and the error of the merge is low. The method of merging according to the root category with the ID as the entry saves the need to traverse the alarm information for clustering. time to merge with.
The host monitoring software Ossec is used in OSSIM to realize the audit record of the host, the collection and analysis of system logs and application programs. It supports file integrity monitoring, registry monitoring, port monitoring, rootkit detection and partial process monitoring. At the same time, Snort is used to collect data packets on the network, complete real-time traffic analysis and test IP packets on the network, etc. It can also perform protocol analysis, content search and matching, and can be used to detect various attacks and sniffing ( such as buffer overflows and ShellCode attacks).
For two events, if they have a high degree of similarity, they are considered to be the same attack and merged; otherwise, they are considered to be unrelated attacks.
We can start by calculating the similarity between the two alarm messages. The first thing to consider is the common attributes of the two alarms. These attributes include attack source, target (host IP and port), attack type, MAC address, time information and event ID, etc. According to this, we can abstract and formalize the attributes of alarm events, and define their attributes as an event attribute set. The starting point of the merging method we use for redundant alarm events is that there is a high similarity between the alarm information for the same attack behavior, and the alarm similarity for different attack behaviors is low. When we merge the redundant alarm information of each product, we also need to consider the alarm information generated by the two security products for the same attack, and try to effectively compress all the repeated alarm information as much as possible.
If Snort finds an attack based on a target IP, it means that the target IP host has vulnerabilities, and its reliability coefficient is 10 (ie, 100% attack success). The value of REL in the figure below is 10, which means that the current time reliability coefficient is 10, so the risk value is 4. This value can also be modified in the data source.
As can be seen from the above, the values of reliability and priority determine the size of the risk. The method of manually modifying the data source REL/PRIO is shown in the following figure. Note that this modification is valid globally, not for a single event. Through sensors, the data of each monitoring node is associated to form a data chain, and then the correlation analysis engine and rules work together to analyze the hacker attack behavior, trace the source, and issue an Alarm. The following analysis of its generation principle.
Alarm Events are generated by Correlation Directives and Rules. The alarm information displayed in Alarm is obtained by matching a large number of events through correlation rules. After OSSIM 5, the system adopts a graphical display OSSIM system. Alarm mode, which makes it easy for administrators to filter important parts of a large number of security events. The alarm event generation process is shown in the figure.
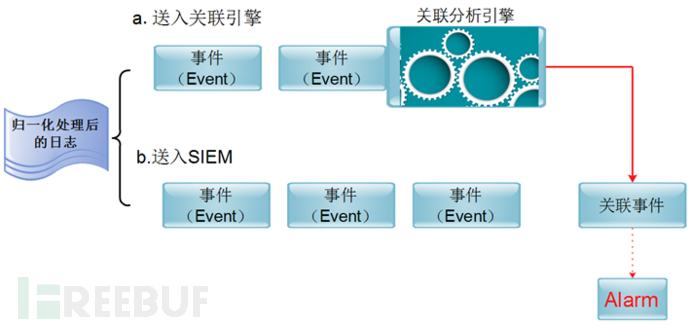
The specific Alarm generation steps are as follows:
(1) Logs are collected to OSSIM;
(2) After the logs are unified and normalized, events are generated;
(3) Import these events into the correlation engine;
(4) Match out new events according to the association rules.
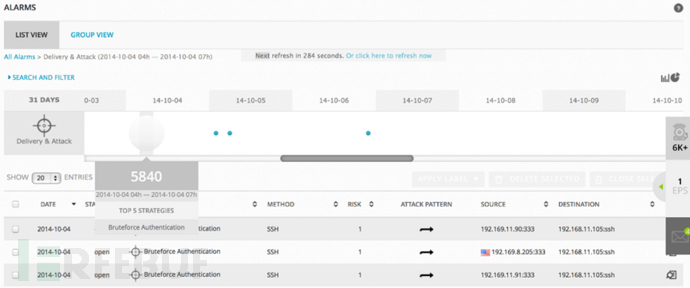
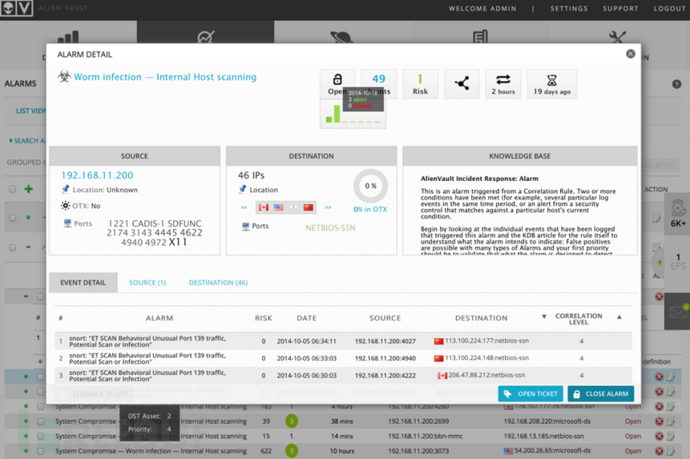
Through the picture shown above, even a security novice can easily detect the brute force attack against the SSH service.
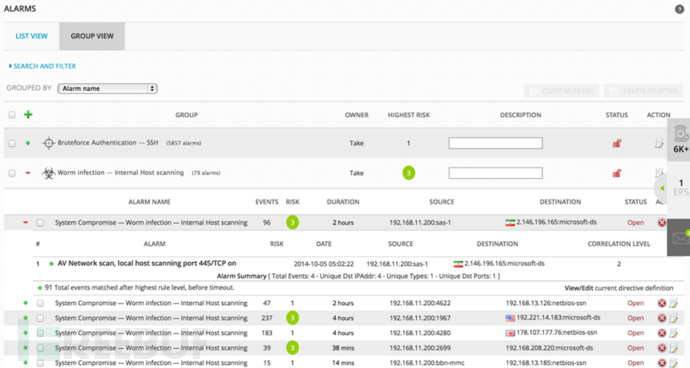
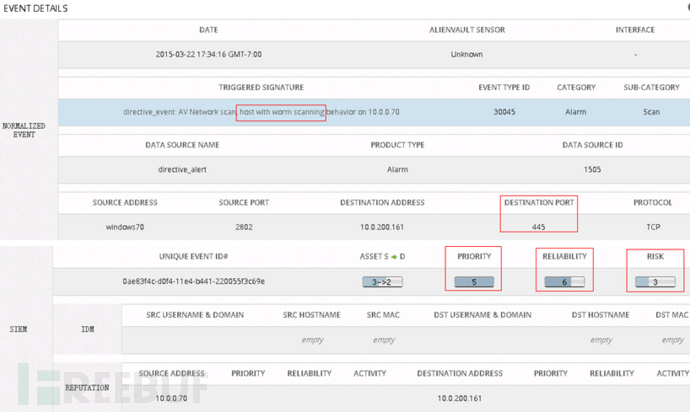
In this picture, we only take System Compromise→Worm infection→Internal Host scanning alarm as an example. In the system damage, the scanning behavior of internal hosts appears. This kind of behavior is suspected to be the scanning of network worms. We know that scanning host vulnerabilities are often spread by worms. The premise is that worms are often detected by ICMP Ping packets, TCP SYN, FIN, RST and ACK packets, and they are random. As can be seen from the figure, the system defines the risk value of such events, the duration of scanning, and the source address. , destination address, source port, destination port and association level, it is easy to be found by OSSIM for this abnormal behavior.
5. Association Rules Instructions
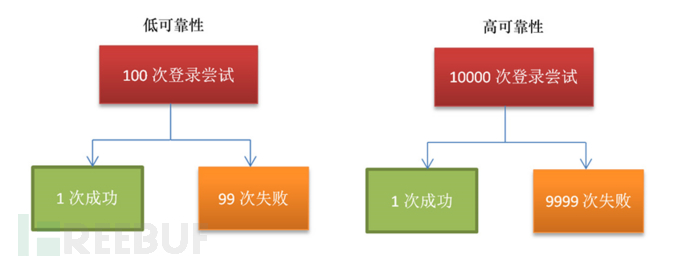
The core of association analysis is completed by one or a group of association instructions. The following is an example of SSH brute force cracking. SSH brute force cracking (Brute Force) is an attack behavior derived from UNIX since the birth. According to statistics, it is found that about More than 50% of the usernames are root. A low reliability SSH server successfully logs in after 100 login attempts, while a high reliability SSH server succeeds after 10,000 logins, then the correlation engine can pass within a certain period of time. , the number of logins, and the different source addresses and the same destination IP address at these times, as well as which countries these IP addresses come from, and their reputation to comprehensively determine the attack and respond.
The source code of the association instruction rule for detecting SSH brute force attack is described in XML as follows:
<directive id="50113" name="AV-FREE-FEED Bruteforce attack, SSH service authentication attack against DST_IP" priority="4">
<rule type="detector" name="SSH service authentication attempt failed detected" reliability="1" occurrence="1" from="ANY" to="ANY" port_from="ANY" port_to="ANY" plugin_id="4003" plugin_sid="1">
<rules>
<rule type="detector" name="SSH service authentication attempt failed detected" reliability="2"occurrence="5"from="1:SRC_IP" to="1:DST_IP" port_from="ANY" time_out="30"port_to="ANY" plugin_id="4003" plugin_sid="1">
<rules>
<rule type="detector" name="SSH service authentication attempt failed detected"reliability="4"occurrence="10"from="1:SRC_IP" to="1:DST_IP" port_from="ANY" time_out="60"port_to="ANY" plugin_id="4003" plugin_sid="1">
<rules>
<rule type="detector" name="SSH service authentication attempt failed detected" reliability="6"occurrence="50"from="1:SRC_IP" to="1:DST_IP" port_from="ANY" time_out="300"port_to="ANY" plugin_id="4003" plugin_sid="1">
<rules>
<rule type="detector" name="SSH service authentication attempt failed detected" reliability="8"occurrence="500" from="1:SRC_IP" to="1:DST_IP" port_from="ANY" time_out="36000"port_to="ANY" plugin_id="4003" plugin_sid="1">
<rules>
<rule type="detector" name="SSH service authentication attempt failed detected" reliability="10"occurrence="1000" from="1:SRC_IP" to="1:DST_IP" port_from="ANY" time_out="86400"port_to="ANY" plugin_id="4003" plugin_sid="1"/>
<rule type="detector" name="SSH service authentication sucessful" reliability="10" occurrence="1" from="1:SRC_IP" to="1:DST_IP" port_from="ANY" time_out="10" port_to="ANY" plugin_id="4003" plugin_sid="7"/>
</rules>- 1.
- 2.
- 3.
- 4.
- 5.
- 6.
- 7.
- 8.
- 9.
- 10.
- 11.
- 12.
- 13.
- 14.
Parameter explanation:
These instructions are often described in XML. If you don't understand their meaning, you can't start when you write or modify the script yourself. The entire association rule system has a complete rule attribute with the following meanings:
Id, this attribute allows to define a unique identifier for the associated instruction. Such numbering must follow the instructions issued by OSSIM. So that the classification display implemented in the frame (sub-command menu of the context menu) can be accurately implemented. Numbering commands are available in this submenu.
Name, this property allows to define the name of the directive. (displayed when the command matches)
SRC , source IP address
DST, destination IP address
Port_from source port
Port_to target port
Priority, this property allows to define the priority of the associated instruction.
Type, which defines the rule type. There are only two types of rules.
Detector, using rules for detecting part information, which is contained in the server database.
Reliability (reliability, also called credibility), the larger this parameter (closer to 10), the more real the alarm is. This parameter is critical during the association process. In fact, as the rules are matched successively, the probability of false alarms in this group will decrease. So it is possible to modify the reliability of advanced alerts in each tagging rule. Subsequent rules will estimate its reliability either relatively (eg: +3, which means that the global reliability has improved by 3 levels relative to the previous rule) or absolute (eg: 7, indicating that the current reliability level is 7). grade.
Occrrence , frequency of occurrence
Plugin_id, this attribute defines the source of the alert expected by the rule. In fact, each plugin has a correlation ID that allows the plugin to be referenced in correlation rules.
Plugin_sid, this parameter defines the event associated with the plugin. In fact, all events recovered by OSSIM are indexed (according to its plugins) and configured. A plugin_sid can be configured by clicking on the desired plugin_id in the plugins submenu of the configuration menu. For example, the alert provided by plugin_id 1501 and plugin_sid400 is equivalent to: "apache: Bad Request" With these two attributes (plugin_id and plugin_sid), it is possible to define exactly what the rule expects.
Time_out, the timeout setting, this property allows to indicate the waiting time for events that meet a certain rule. If this event does not occur within the given time (measured in seconds via the property), the correlation instruction ends and returns to the result of the previous rule calculation. This property determines the temporary window in which alerts (events) expected by the rule must be displayed.
Protocol, this property allows to configure the type of network events expected by the rule. Three types of protocols can be defined: TCP, UDP, ICMP, and this attribute allows absolute references. This means that it is possible to reuse the protocol type that matched the previous rule. So, just do the following: protocol="1:PROTOCOL" to make it clear that the protocol of this rule is the same as the protocol matched by the first-level rule. If you want to restore the protocol matched by the second-level rule, just express it explicitly: protocol="2:PROTOCOL".
From, this attribute allows to explicitly indicate the IP source address of the pre-alarm. It can be represented using 6 different ways:
①ANY, indicating that any address source matches this attribute.
②x.xxx IP address.
③ By reference, it is consistent with the principle of referencing protocol attributes. (Example: 1: SCR_IP= the source address of the alarm that matches the first-level dependent instruction, 2: DST_IP= and the destination address of the alarm of the second-level dependent instruction).
6. Actual combat of association rules
The rules are displayed after importing the rules into the OSSIM correlation analysis engine, as shown in the following figure.
Start testing when everything is ready:
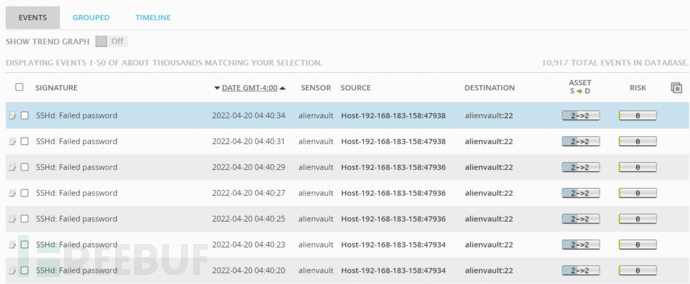
Start the medusa pair on the attacking machine (Kali 2021, 192.168.183.158), and test the ssh port opened by the target machine (the command is omitted). Then log in to the target machine (192.168.183.139) to view the SSH log:
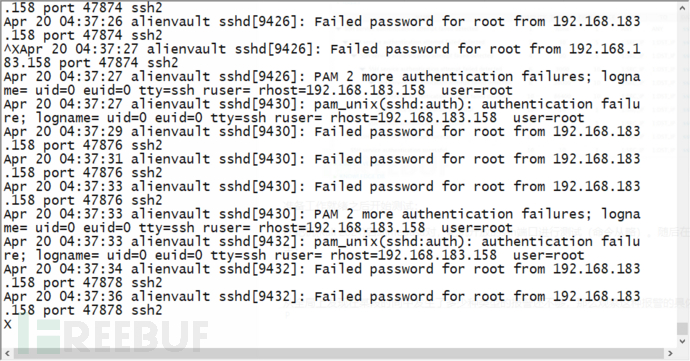
The traditional way to analyze these logs is time-consuming and labor-intensive, and it is often impossible to determine the fault in time. I have not seen the normalized events of OSSIM below, as shown in the following figure.
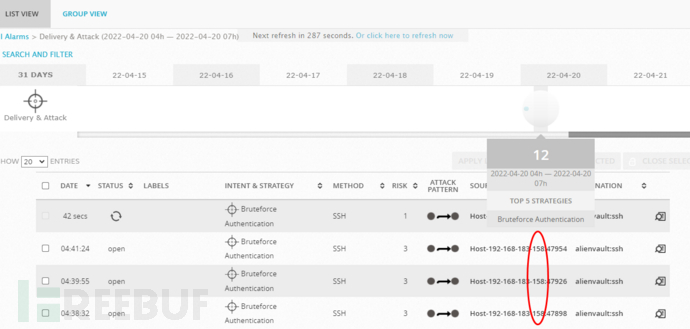
Correlation analysis results:
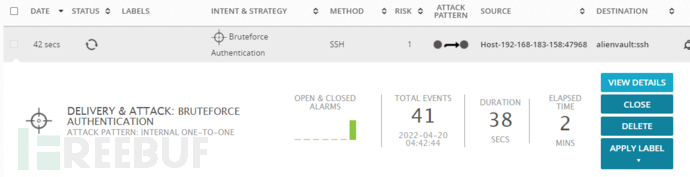
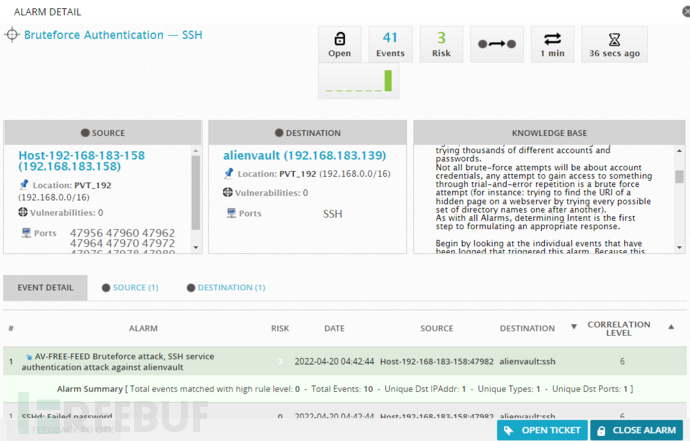
It can be seen from the above figure that the risk value is 3, which can obviously be characterized as a brute force attack against the SSH service. This process is completed automatically, the rules are written correctly, and the alarm is automatically realized without manual intervention.
Thousands of words are not as clear as a video: The following video is an actual clip of log correlation analysis.
https://mp.weixin.qq.com/s/BnedVIy8h4eCf80dNJG_Gw?source&ADUIN=1989365079&ADSESSION=1650851489&ADTAG=CLIENT.QQ.5887_.0&ADPUBNO=27211
7. Summary
It is a bit difficult for beginners to start writing rules from a blank sheet of paper, but according to the default rules given by the system, it is still achievable. No matter whether the model is perfect or not, use it first, and then modify it gradually. At the right time, perform a penetration test on the system, then monitor the SIEM's response to see if it generates the correct alerts and if the alerts provide enough information to assist in figuring out what threats have occurred, if not then the rules need to be modified , and then you need to constantly optimize the threshold. This article briefly introduces the network log correlation analysis technology under the OSSIM platform, hoping to provide you with some help in daily network security operation and maintenance.