Why AI won’t solve your production problems
AI can follow your instructions, but it still can’t debug problems like you can.
Translated from Why AI Can't Fix Your Production Issues, author Siddarth Jain.
Generative AI and Large Language Models (LLMs) have significantly improved productivity across industries and fields, from marketing to engineering. As an early-stage founder, I personally find them very useful in my daily workflow, from creating management document templates to assisting with code syntax.
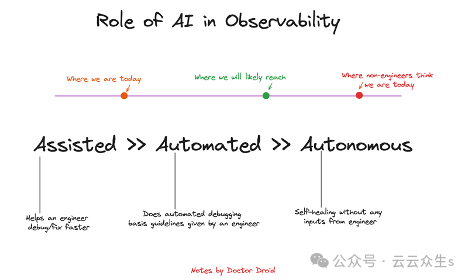
There has been a lot of discussion about how AI can replace engineers, including a StackOverFlow blog post about why AI can’t replace engineering teams. In this blog, I will lay out why I think AI, while a great productivity enhancement tool, can’t debug production issues for today’s shift engineers and SREs.
 picture
Practical applications of LLM:
AI tools that act as assistants are useful throughout the lifecycle. Here are a few examples where I’ve used them:
Code Generation/Instrumentation:
LLM is a great way to get boilerplate code for a function or task. While I end up rewriting most of the code, I do like the experience of not having to start from scratch but starting at a certain point (like 30%).
- Github CoPilot
- Terraform Generator — https://github.com/gofireflyio/aiac Here is a recent blog post about a user’s experience with Terraform builds/updates using LLM.
Natural language to command
I find Warp's natural language to command generator very useful instead of using chatGPT to look up new commands. But for something I'm doing for the first time, or if I know a command, I'm very reluctant to use natural language mode. It helps me naturalize and speed up the learning curve to learn the syntax/language.
- k8sGPT
- Warp.Dev
My Background
My experience with machine learning started when I didn’t even call my job machine learning. As a young developer in 2015, I spent a summer developing an application that digitized and parsed millions of offline documents using OpenCV. Since then, I’ve dabbled in supervised/unsupervised learning, constrained optimization problems, forecasting, and NLP in various roles.
For the past few years, I have been the co-founder of Doctor Droid, a company focused on solving challenges in the lives of shift engineers.
Engineers’ expectations for AI/ML in production event monitoring:
As a founder, I pitch different prototypes to other developers to solve parts of the “observability” lifecycle. When pitching to users, I often find that engineers’ excitement levels are particularly high whenever any of the following use cases are mentioned:
- Predicting/forecasting events before they happen
- Anomaly detection, get alerts without configuration
- Using AI to automate incident investigations
Naturally, I built prototypes and tools that tried to address one or more of these use cases.
Before I dive into the prototype, I want to share my thoughts on debugging.
CAGE framework for debugging and production investigations
This framework was inspired by my engineering experience in a previous job and interactions with the Doctor Droid developers. I realized that debugging usually comes down to four things:
Context:
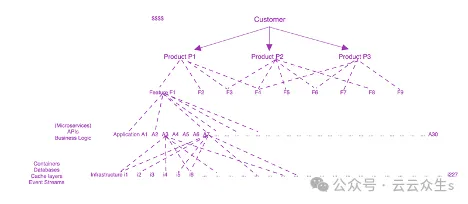
This refers to tribal knowledge about what your product does, how customers interact with it, how infrastructure maps to services, features, and so on. Your customer complaints may not be objectively translated to specific infrastructure components. Without being able to translate the problem/use case into the right context, even existing developers on the team will have a hard time resolving production issues.
 picture
Analytical Thinking
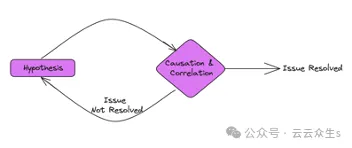
Engineers are expected to generate hypotheses and use correlation and causation to validate/refute those hypotheses. Correlating timelines and anomalies (usually discovered through visual observation) is a skill that requires some analytical thinking on the part of engineers - whether it's observing a metric and assessing if it's an anomaly, or observing an anomaly and thinking about what else might be affected (using their tribal knowledge).
 picture
Goal Definition:
The operations of an engineering team are highly dependent on the business commitments and needs of the organization. It’s not enough to just have an analytical mindset. Last year, we were building an analytics platform - even with only four services deployed, we generated over 2,000 metrics covering our infrastructure and applications (see the next section for more on this application).
If we applied analytical thinking to evaluate all of these metrics for alerting, it wouldn’t make sense to anyone on our team. Therefore, we defined SLOs and prioritized metrics so that we could prioritize them. This was critical in helping the on-call engineer understand when and what to escalate/investigate/downgrade.
Entropy estimation:
Problems in production often have a cascading lifecycle, including before and after the problem occurs:
- Before the problem occurs: The problem may be caused by a series of "unexpected" changes in the behavior of one component (for example, this Loom event), cascading to more components.
- After the problem occurs: Minor glitches or inaccurate attempts when trying to apply fixes/patches (such as this AWS incident) can further escalate the problem.
Engineers expect to maintain full activity even after stabilization to prevent possible increases in system entropy.
Experiment and learn:
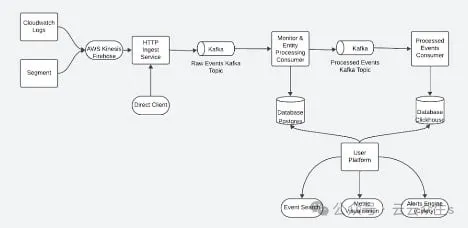
The following experiments were conducted on the production system of Kenobi, a real-time analysis platform built by Doctor Droid in 2023. The following is the architecture of the platform:
 picture
The platform (in its current form) has four microservices and took about five developers six months to build. The platform processes 20-30 million events per day from various sources and makes them available for querying in the UI and alert evaluation in less than 10 seconds. You can read more about the platform here.
Experiment 1: AI Investigation Assistant
Define the goals of this experiment:
- Input: An alarm was triggered in the system
- Output: Investigation runbook used by the on-call engineer to investigate/fix the issue
- Problem this tool solves: Lack of runbooks/guidelines, leading to delays in investigations.
Solution:
The prototype works as follows: It receives a webhook for each alert from Slack. The prototype then analyzes the context of the alert and tries to recommend the most relevant steps by leveraging the contextual information available to the user.
The following are the data sources used for Context:
- Internal duty SOP of the team (depending on the situation)
- Added context for platform-specific metrics and data sources that can be used for debugging.
 picture
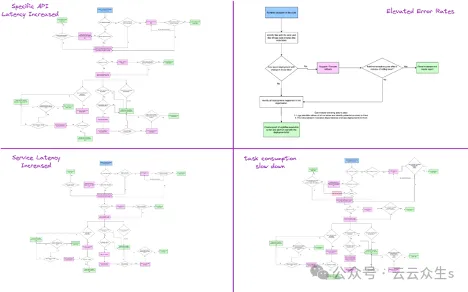
A mental model for how to debug problems in a microservices application
 picture
result:
 picture
On the surface, the output quality of an experiment looks good. However, once you test it in production, or give it to someone trying to investigate, the on-call engineer will eventually run into the following issues:
- Generic Recommendations: - "Check CloudWatch for metrics on relevant infrastructure" is a generic recommendation and can mean many metrics unless the developer knows exactly which components are most relevant.
- Wrong suggestions:- In one of the steps, it was suggested to check the logs in ELK/Kibana, but Kibana was not in the team's stack.
- Low confidence remediation:- Remediation often requires support from relevant data, which current approaches cannot provide. It is also impractical to run anomaly detection ML models on a wide range of metrics given the number of common checks recommended.
While these suggestions feel like an exciting start, we realized that on-call engineers often prefer the following approaches to reduce the time spent debugging issues:
- Follow the steps in the documentation/runbook "verbatim"
- Escalate it to the engineer/team that might be closely associated with the issue
With this lesson learned, we decided to shift our focus from intelligence to providing a framework for automation.
Lab 2: Open Source Framework for Automating Production Investigations (with Optional AI Layer)
Target:
- Input: Users configure their observability tools and their investigation runbooks
- Output: When an alert is received, the playbook will automatically trigger and the team will then receive the analysis results as an enrichment of the alert in the original source (Pagerduty/Slack/Teams etc).
- Problem this tool solves: On-call engineers need to manually debug issues, which often leads to escalation to other engineers.
result:
This framework improves the development efficiency of participating users by up to 70%. In addition to the data, we have some additional learnings:
- Preference for deterministic results: Given the critical nature of the questions asked while on duty and the risk of escalation or loss of business, engineers prefer deterministic results over probabilistic ones.
- Resistance to manual configuration: Given that the framework relies on the user’s debugging steps/process, some teams have challenges with manually configuring runbooks as they fear it is time consuming and recurring issues are usually automated.
- Applicable only in certain situations: Exploratory questions require the user to go beyond the frame.
The AI used in Experiment 2 is:
(a) Generating playbooks from documents: We wrote a small agent that reads existing documents and maps them to the integration tool. The goal of this tool is to reduce the effort of configuring playbooks.
This output is similar to the previously mentioned blog post about Terraform Generator - it is still not an automated mode and requires user review and iteration.
(b) Generating summaries from data
This summarizer helps users read the most relevant points first, rather than manually going through all the data.
As you can see, these are auxiliary implementations and are highly dependent on the central framework.
Real-world use cases for observability using AI/ML
AI/ML brings a lot of opportunities in the observability space, but they will be designed for specific/narrow contexts. The scope of “production debugging” is broad, but here are three narrower examples of where AI/ML is being used today:
- Summary and classification of the survey:
- Creating an AI layer that analyzes the data extracted by the automation framework and sends summaries back to engineers can reduce the time they spend investigating issues.
- Several companies have implemented this capability internally. Microsoft has a paper on this, discussing their product RCACoPilot (although the name is CoPilot, the tool is very deterministic in its debugging/investigation approach and relies only on LLM for summarization and event classification).
 picture
(The "handlers" for the collection phase are user-written runbooks for each alert/event.)
- Deployment monitoring and automatic rollback:
- A common use case in prediction and anomaly detection implementations is in deployment contexts, as they are often the source of problems and are well known.
- This approach has been adopted by several companies; two publicly known ones are: Slack and Microsoft.
 picture
- Alert Grouping and Noise Reduction:
- Narrowing the context to just the alert helps enable intelligence within the platform. Here are some of the intelligent insights that AIOps platforms (today) can provide on top of user alert data:
Group and correlate alerts based on tags, time, and history.
Analyze the alarm frequency to understand if it is a noisy alarm.
in conclusion
After all this experimentation and prototyping, I came to two main conclusions:
- Even modest adoption requires far less noise than the status quo of custom-configured systems.
- Continuing from the first conclusion, it is not common to achieve these low noise thresholds out of the box. Optimizing them usually requires a lot of custom work for each team/use case.
As a result, you’ll see many tools and platforms leveraging AI/ML in their observability stack, but it will likely be limited to specific areas where it assists engineers rather than being a “full replacement for engineers.”