Carrier Routing Network Mining with Improving Timeliness and Accuracy

Carrier Routing Network Mining with Improving Timeliness and Accuracy
1. Primer
Contract fulfillment time is the lifeline of e-commerce, which is directly related to the user's consumption experience. Xinhuanet [5] reported on Double Eleven in 2022 that 37.4% of the respondents hoped that the goods would be delivered the next day, and 29.91 % hoped that the goods would be delivered on the same day. Compared with other items, the respondents have higher requirements on the delivery timeliness of mobile phones, computers, and digital products, and hope to receive the goods on the same day or within 1 -2 days.
In the contract fulfillment scenario, the main stages include in-warehouse production and delivery by third-party carriers. When the user pays, Dewu will give the user a promise time limit according to the production situation of the warehouse and the distribution resources.
1.1 Why do we need to predict the timeliness of the carrier's line
In the process of fulfilling the contract, Dewu needs to monitor the flow of orders and timely discover orders that may be overdue (compared with the time limit promised by the user), which includes the monitoring of warehouse production and third-party distribution . the actual process, we found that when the distribution node changes, the forecast given by the carrier is conservative. In the following example, the carrier in the sales department will give a more accurate estimated delivery time, so the estimated delivery time of the carrier in the sorting center is prone to false positives.
Outlets | departure time | Carrier Estimated Delivery |
xxx outlets | 2022-12-02 07:05:47 | 2022-12-10 22:00:00 |
A collection and sorting center | 2022-12-02 14:09:19 | 2022-12-10 22:00:00 |
B collection and sorting center | 2022-12-04 07:42:03 | 2022-12-10 22:00:00 |
C bulk cargo sorting center | 2022-12-05 04:58:28 | 2022-12-09 22:00:00 |
D Sales Department | 2022-12-05 08:47:58 | 2022-12-05 15:00:00 |
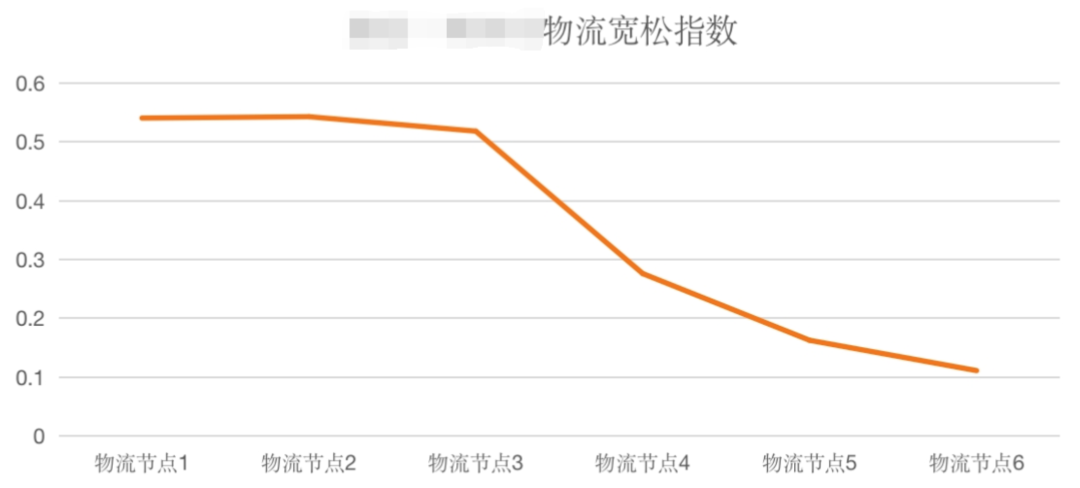
The figure below shows the looseness index of the estimated delivery time returned by the carrier interface. It can be seen that the promised time limit is more accurate when it is close to the destination.

2. How the carrier network works
Before building a carrier network, you need to understand how a carrier network works. The following is a schematic diagram of the distribution from point A to point E, which is divided into the following contents:
(1) Nodes, including collection and delivery outlets and sorting centers.
(2) Lines, including trunk lines and branch lines. For example, the branch line from the outlet to the sorting center belongs to the branch line, and the main line from the sorting center to the sorting center.
(3) Shifts: In order to balance cost and timeliness, the carrier will set up production shifts. After arriving at the sorting center, it needs to be sorted according to the destination. When a certain amount of goods arrives, it will start from the sorting center and go to the next node. When the carrier sets the shift, it will consider the order quantity, taking into account the cost and timeliness of transportation.

Picture above: Taking purple as an example, at outlet A, the order is cut off at 8:00 in the morning, that is, the goods handed over to the carrier before 8:00 will be sealed at around 8:20, and then depart from the outlet to B sorting center , the time to arrive at sorting center B is 11:40. At this time, the shift of sorting center B with a cut-off time of 12:00 is caught up. Sorting center B will complete the sorting at 12:30 and go to the next sorting center , and so on to complete the entire distribution process.
When building a network of carriers, modeling is required. In addition to nodes, lines, and shifts, the core includes the following two models:
(5) Finished product line, that is, passing through all nodes from A outlet to E outlet. In the picture above: A outlet - B sorting center - C sorting center - D sorting center - E outlet constitutes a finished product line.
(6) Waves of finished product lines: Because nodes have waves, there are also waves of finished product lines. In fact, the wave number of finished product lines is the same as that of the first node.
3. How to build a carrier network
Now that you understand how a carrier network works, you need to start building your carrier's network. The carrier will push the track information to Dewu, the content is similar to the following text.
[
    {
"code":"180",
"desc":"快件到达【xxx营业部】",
"location":{
"city":"xxx市",
"district":"xxx县",
"point":{
"latitude":xxx,
"longitude":xxx
            },
"province":"xxx"
        },
"node":"已揽收",
"opeTitle":"站点装箱",
"time":"2022-09-04 17:29:27"
    },
    {
"code":"xxx",
"desc":"收取快件",
"location":{
"city":"xxx",
"district":"xxx",
"point":{
"latitude":28.65,
"longitude":120.07
            },
"province":"xx"
        },
"node":"已揽收",
"opeTitle":"配送员完成揽收",
"time":"2022-09-04 17:29:27"
    }
]- 1.
- 2.
- 3.
- 4.
- 5.
- 6.
- 7.
- 8.
- 9.
- 10.
- 11.
- 12.
- 13.
- 14.
- 15.
- 16.
- 17.
- 18.
- 19.
- 20.
- twenty one.
- twenty two.
- twenty three.
- twenty four.
- 25.
- 26.
- 27.
- 28.
- 29.
- 30.
- 31.
- 32.
- 33.
- 34.
3.1 Structured cleaning
The text of the trajectory needs to be structured and cleaned before the meaning of the trajectory can be obtained. For each waybill, its trajectory will pass through many nodes, and the data type of each node is as follows:
1. waybill_no 表示运单号,同一个运单号会有多条节点记录
2. station_index 表示当前这个节点的下标
3. station_enum 表示这个节点的类型,是分拣中心还是揽派网点
4. station_name 表示节点的名称,例如上面例子里的xxx营业部
5. station_status 表示这个节点的状态,例如是进入还是离开
6. operate_time 表示当前节点的操作时间- 1.
- 2.
- 3.
- 4.
- 5.
- 6.
3.2 Is there really shift information in the track?
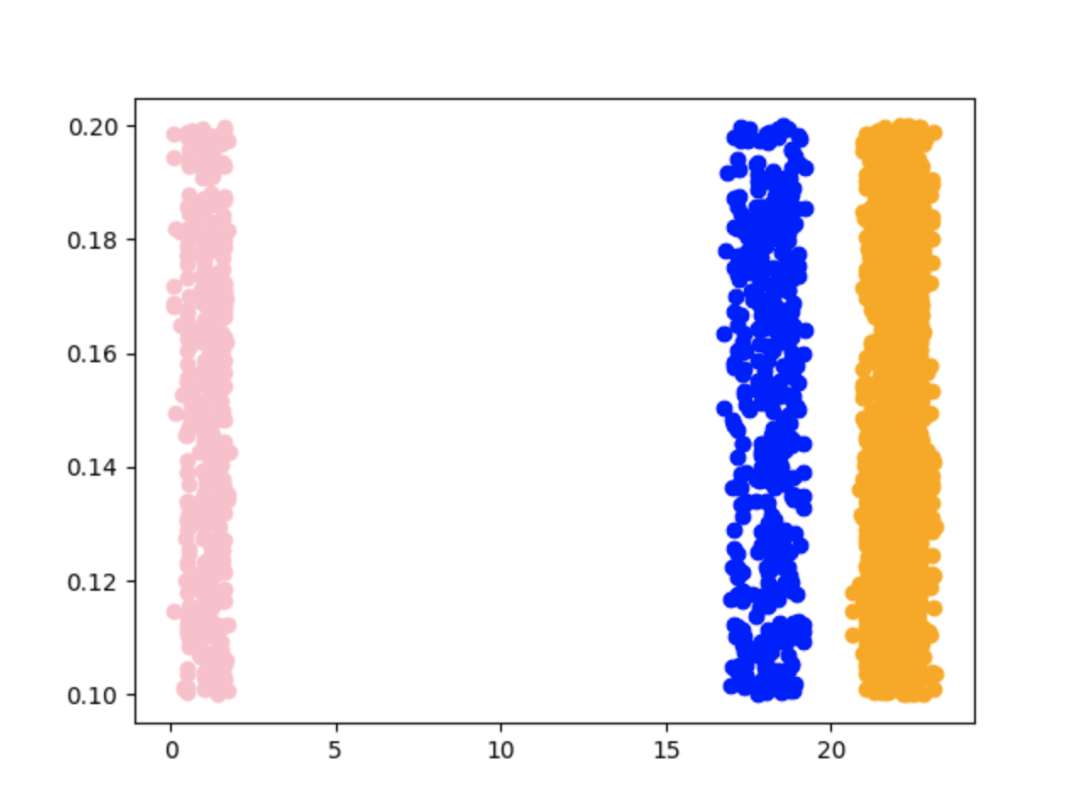
The working principle of the carrier network mentions that the carrier will produce by shift. Can you find evidence of shift production from the track results? Through analysis, we guess that the time for the same flow direction (such as from A sorting center to B sorting center) to leave a certain sorting center (such as leaving A sorting center) should be relatively concentrated.
In real time, through some simple clustering methods, our conjecture is confirmed. In the figure below, the horizontal axis represents the hour of departure from the sorting center, and each point represents a certain waybill in history. The vertical axis has no business meaning , but is for convenience of display.

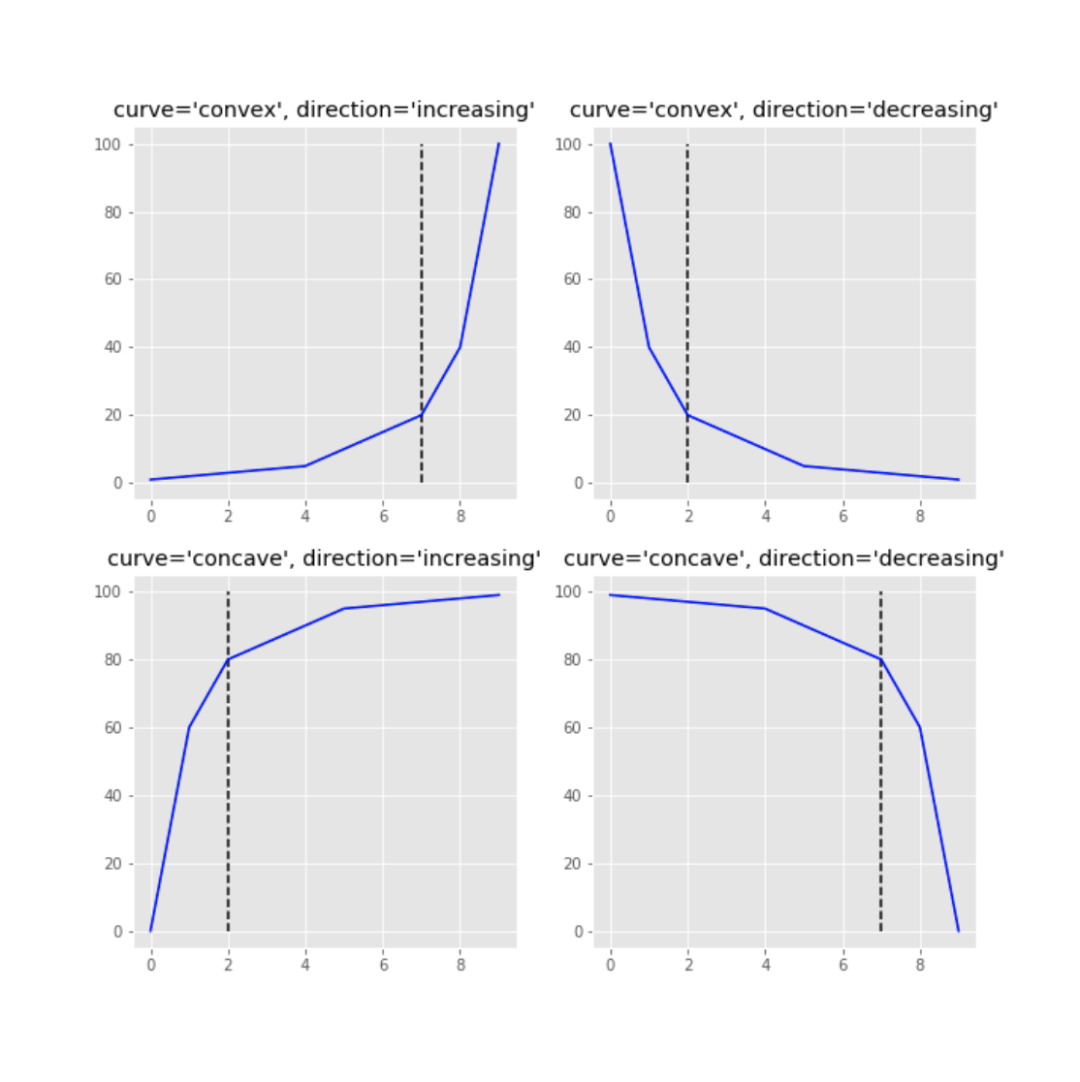
The kmeans clustering algorithm is used to draw the above graph, and the kmeans clustering algorithm needs to specify the number of clusters. Therefore, it is necessary to use algorithms such as Knee/Elbow for cluster number detection, and it is sensitive to outliers, so DBSCAN is finally used in the implementation.

3.3 How to choose clustering parameters
Although DBSCAN does not need to specify the number of clusters, it needs to specify the distance between points and the density of points. After repeated adjustments, the parameters of these two cores are finally determined as follows:
Where eps is 0.25, which is 15 minutes. The point density is a maximum of 5 and 2% of the total.
3.4 How to solve the cross-sky problem
From the above cluster diagram, the points of the same wave may appear across days, that is, the time of some points from the distribution center may be 23:50, and the time of some points from the distribution center may be 00:10. The Euclidean distance between these two points is relatively large, so the metrics function of the distance needs to be rewritten.
def metric(x, y):
ret = abs(x[0] - y[0])
if ret > 12:
ret = abs(24 - ret)
return ret- 1.
- 2.
- 3.
- 4.
- 5.
3.5 How the lines are connected in series
It is not enough to analyze the production shifts of the nodes and the shifts of the lines. They also need to be connected in series to obtain the shifts of the finished product lines, so that they can be applied before or during sales. Some simplifications have been made in the processing here. On the one hand, the sorting waves of the sorting center cannot be identified. On the other hand, it is not necessary to pay attention to the sorting waves of the sorting center.
In fact, the process of concatenating finished product line shifts is as follows:

The core code is as follows:
for (int i = 1; i < tmp.getResourceList().size(); ++i) {
    List<NetworkResourceWaveDTO>
next = tmp.getResourceList().get(i)
            .getWaveList();
next.sort(Comparator.comparing(NetworkResourceWaveDTO::getOffTime));
    boolean match = false;
for (NetworkResourceWaveDTO nextWave : next) {
if (nextWave.getOffTime() > p.getEndTime()) {
            match = true;
            duration += nextWave.getDurationDay();
            p = nextWave;
break;
        }
    }
if (!match) {
        duration += next.get(0).getDurationDay() + 1;
        p = next.get(0);
    }
    productLineWave.add(p);
}- 1.
- 2.
- 3.
- 4.
- 5.
- 6.
- 7.
- 8.
- 9.
- 10.
- 11.
- 12.
- 13.
- 14.
- 15.
- 16.
- 17.
- 18.
- 19.
- 20.
3.6 How is the relationship between the fourth-level addresses and Lanpai outlets established?
From the application point of view, the input condition is the buyer's fourth-level address, but the end point of the carrier network is the delivery site, so it is necessary to establish a mapping relationship between the carrier's delivery site and the fourth-level address. The establishment of the mapping relationship is relatively simple. Among the sites responsible for dispatching the four-level address in the past period of time, the one that dispatches the most orders for this address is selected.
4. The challenge of project landing
Part 3 is more like a theorist's eloquence, so how to implement it in engineering? This includes the development of ODPS SQL, UDF development and DDD, in short, eighteen skills are required.
4.1 How to perform simple machine learning in ODPS
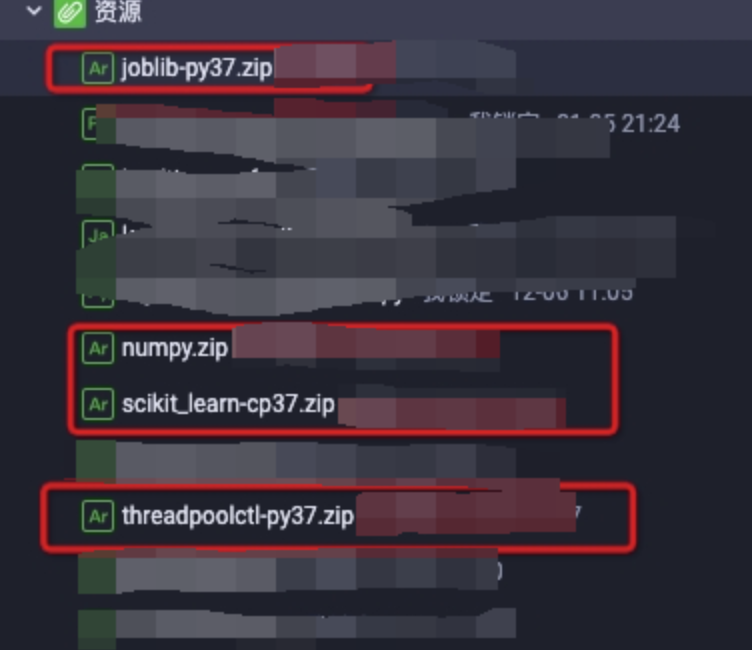
In the process of shift analysis, the clustering algorithm of DBSCAN is used. What if these algorithms are used on odps? In fact, the DBSCAN algorithm has been implemented in python, and odps supports writing UDF in python. It’s just that the current odps operating environment does not install DBSCAN-related packages, so it needs to be installed manually. For the installation tutorial, please refer to the official documentation of Alibaba Cloud.

4.2 Problems of online service
The above cleaning process needs to be run once a day or at least once a week, and the data of a time window in the past is selected for training to obtain the carrier's network, so as to sense changes in the carrier's network in a timely manner. This means that the finished product line, finished product line wave, and node wave information will be regularly updated. In the process of online service, we directly store the data in redis. In order not to occupy too much memory, the memory is optimized by using the hash data structure. Of course, one disadvantage of hash is that the timeout period cannot be set for the field, which means that the data of a certain field of a certain key is actually expired data. , but it will not be deleted, causing a leak, but this leak can be resolved by other technical means.
5. Progress and planning
At present, we have built a third-party carrier network, and the accuracy rate of the first network point prediction is about 65%, and the accuracy rate of the final sorting prediction is about 85%. Future continuous optimization points include: shift aggregation (for some lines with relatively sparse data, shift aggregation needs to be done), time decay (cleaning data needs to select data from a period of time in the past, and for data that is too old, it should be decayed so that it is in the result The contribution in is smaller), etc., I believe that the accuracy rate can be further improved.