Talking about Telemetry Network Telemetry Flow Analysis Technology

Talking about Telemetry Network Telemetry Flow Analysis Technology
·Introduction·
With the rapid development of cloud-native, cloud-network integration, and big data, automated network O&M is also on the rise. Telemetry network telemetry features are becoming more and more important. Telemetry, as the name implies, is a technology for obtaining network measurement data at long distances. For example, in aerospace, geology, and ocean fields, satellite sensor data can be obtained through telemetry technology. When Telemetry technology is applied to the network, it can also collect network data remotely and at high speed from physical and virtual network devices, providing reliable, real-time, and high-precision data for network analysis.
According to different network telemetry data sources, it can be divided into management plane, control plane and data plane telemetry. The management plane collects network management data based on GRPC/NETCONF, the data plane collects data plane data based on IOAM, and the control plane reports control protocol data based on BMP (BGP Monitoring Protocol).
This article focuses on the detailed introduction of Telemetry telemetry technology.
Advantages of Telemetry
Compared with traditional network monitoring technology
When it comes to network device management and monitoring, the first thing that comes to mind is SNMP. SNMP is a Simple Network Management Protocol, and it is also a widely used network monitoring technology. Taking the CPU usage rate of the collection device as an example, the interaction principle of SNMP and Telemetry to collect network device data is as follows:
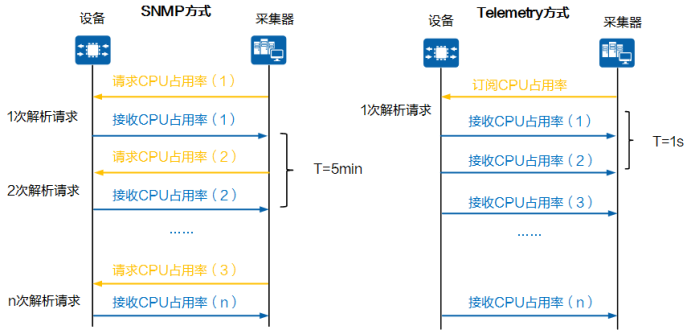
As shown in the figure, there are two main differences in the interactive process of collecting data between the two:
1. From the acquisition model, Telemetry takes up very little network equipment performance. The SNMP collector and the device adopt a question-and-answer interaction method. The collector sends an SNMP get request every time it collects data, and the device needs to respond to each get request, while Telemetry only needs one subscription and parsing request. After the subscription is completed, the subsequent devices will continue to push data to the collector according to the collection period specified by the subscription, with little performance loss to the network device;
2. In terms of collection cycle, Telemetry has higher collection accuracy and frequency. The SNMP get request collection cycle depends on the overall time for the network to poll all monitoring objects in the network once. Usually, the shortest recommended interval is 5 minutes, while the Telemetry collection interval can be 1 second. The highest precision can reach sub-second level, and the precision can be fine-grained. 300-30000 times.
Therefore, in the case of covering and collecting the same monitoring object, the SNMP protocol adopts the "pull mode", and the device CPU needs to respond to more get requests, while Telemetry adopts the "push mode" and only needs to make one subscription request. CPU performance consumption is smaller. At the same time, the Telemetry collection frequency is higher, and the accuracy is from 5 minutes to sub-second level, which can obtain higher-precision monitoring data, control the consumption of equipment performance, and realize accurate monitoring of network status.
The differences between Telemetry and common network monitoring technologies in terms of working mode and collection accuracy are shown in the following table:

It can be seen from the table that the working mode of Telemetry is the push mode. The device side actively pushes data and provides sub-second precision. In addition, the key point is that Telemetry data adopts standard structure and encoding, which is convenient for docking with third-party devices and helps To improve network monitoring efficiency and monitoring quality. Although SNMP Trap and SYSLOG are also in the push mode, the range of data they push is limited, and monitoring data such as interface traffic cannot be collected in real time.
Technical advantages
The two major advantages of Telemetry are low equipment performance consumption and high data collection accuracy, which can solve some pain points that traditional network monitoring technologies have always faced.
According to the Nyquist sampling principle, when the sampling frequency is greater than twice the signal frequency, the information in the original signal can be completely preserved. When traditional technologies such as SNMP use a 5-minute collection period, there will be a problem of loss of detailed information, as shown in the following figure:
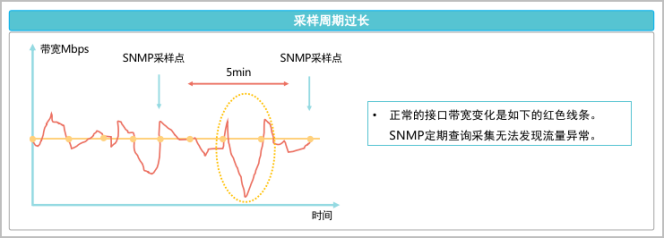
When traditional operation and maintenance methods such as SNMP use a faster data collection cycle to solve this problem, due to the "pull mode", more intensive collection and pulling may cause the CPU of network devices to continue to increase, and even risk paralysis. Therefore, the operation and maintenance technology represented by SNMP cannot meet the real-time and whole-process monitoring requirements of current IT operation and maintenance, and cannot detect network problems caused by a large number of microbursts (Mirco Burst) in the network.
Microburst refers to the phenomenon that a lot of burst data is received in a short period of time (millisecond level), so that the instantaneous burst rate reaches tens or hundreds of times the average rate, or even occupies the port bandwidth. Network management equipment or network performance monitoring software is usually based on a long period of time (several minutes), and the average value during this period is calculated as the real-time bandwidth of the network. In this case, it can be seen that the traffic rate is usually "shaving peaks and filling valleys", showing a relatively stable curve, but the actual device may have lost packets due to microbursts and affected the application system. The figure below shows the comparison curve of collecting data using minute-level SNMP and sub-second-level Telemetry.
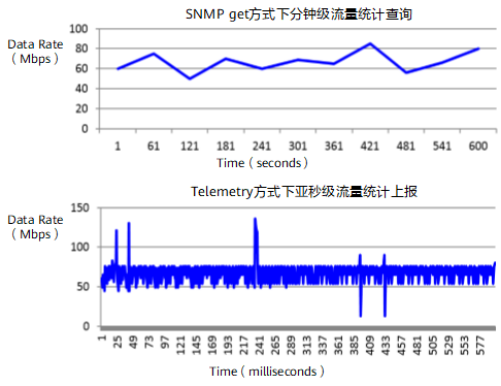
It can be seen from the figure that the port traffic statistics queried in the SNMP get mode are relatively smooth, while the traffic statistics in the Telemetry mode obviously show micro-bursts. Through the high-precision sampling of Telemetry, these micro-burst traffic and port packet loss problems caused by micro-bursts can be detected.
Composition and mechanism of Telemetry automated operation and maintenance system
Operation and maintenance system components
Telemetry in the narrow sense is a feature of network equipment. Telemetry in the broad sense can be understood as a closed-loop automated operation and maintenance system, which consists of four components: network equipment, collectors, analyzers, and controllers, as shown in the following figure:
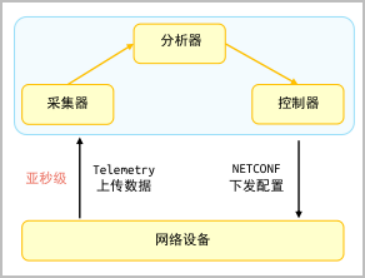
1. Collector
It is used to receive and store the original monitoring data reported by the network device. According to the configuration requirements of the collector, the network device will report the collected second-level or sub-second-level monitoring data to the collector for storage.
2. Analyzer
It is used to analyze the monitoring data received by the collector, process the data, and display the analysis results to the user intuitively in the form of a graphical interface.
3. Controller
Deliver configurations to devices through NETCONF and other methods to control network devices. According to the analysis data provided by the analyzer, the controller sends the configuration to the network device, adjusts the forwarding behavior of the network device, and can also control which data the network device samples and reports.
Operation and maintenance system working mechanism
Collectors, analyzers, and controllers are all located on the network management side, and the network management side and the network device side work together, as shown in the following figure:
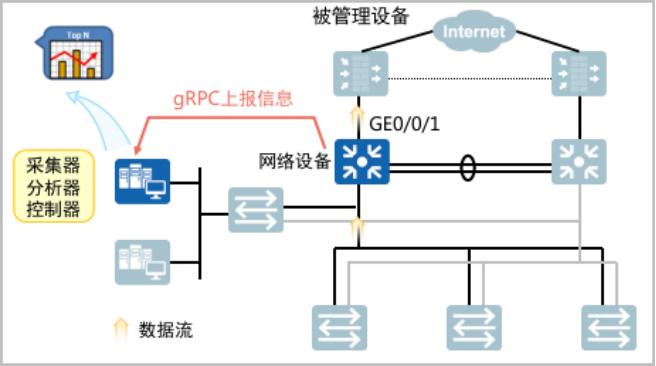
On the network device side, Telemetry organizes data according to the YANG model, uses GPB (Google Protocol Buffer) format encoding, and transmits data through gRPC (Google Remote Procedure Call Protocol) protocol. On the network management system side, Telemetry completes data collection, analysis, and storage functions, and uses the analysis results to provide a basis for network configuration adjustments, as shown in the following figure:

The following is an explanation of some concepts and terms involved in the network device side:
Raw data: The raw data sampled by Telemetry can come from the forwarding plane, control plane, and management plane of network devices. Currently, it supports collecting device interface traffic statistics, CPU or memory data, and other information.
Data model: Telemetry organizes and collects data based on the YANG model. YANG is a data modeling language for designing configuration data models, state data models, remote call models, and notification mechanisms that can operate as various transport protocols.
Encoding format: supports GPB (Google Protocol Buffer) and JSON (JavaScript Object Notation) encoding formats. Telemetry uses the GPB encoding format (the file name suffix of the GPB encoding format is .proto) to provide a flexible, efficient, and automatic serialization mechanism for structured data. GPB is a binary encoding with good performance and high efficiency.
Transmission protocol: supports gRPC protocol (google Remote Procedure Call Protocol) and UDP protocol (User Datagram Protocol). The gRPC protocol is a high-performance, general-purpose RPC open source software framework based on the HTTP2 protocol released by Google. Both parties in the communication conduct secondary development based on this framework, so that both parties in the communication can focus on the business and do not need to pay attention to the underlying communication implemented by the gRPC software framework. It should be noted that the gRPC protocol can be used for Telemetry static subscription or dynamic subscription, while UDP can only be used for Telemetry static subscription.
Telemetry application scenarios
Bank data center network intelligent operation and maintenance scenario
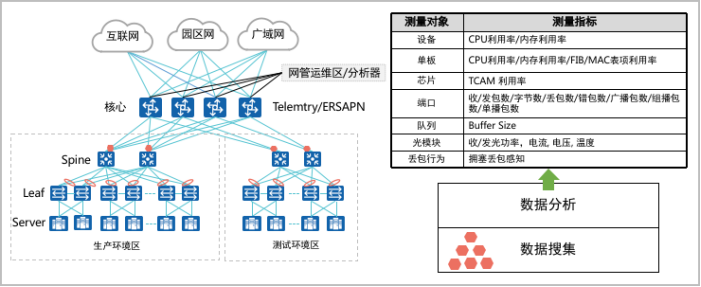
At present, it is understood that ZS Bank, BJ Bank, GS Bank and other peers have piloted the deployment of intelligent operation and maintenance analysis systems in the production and test network environments of their data centers, using Telemetry technology to collect second-level operation and maintenance data to solve the problem of low accuracy of SNMP collection , real-time monitoring of network equipment operating conditions. Deploy an intelligent operation and maintenance system in the data center network. The collector collects device performance data through Telemetry, and the analyzer receives and sends data for statistics, analysis, and presentation. Together with technologies such as ERSPAN remote traffic mirroring, the 1- 3-5 intelligent operation and maintenance.
Scenarios for Carrier Mobile Bearer Network Traffic Optimization
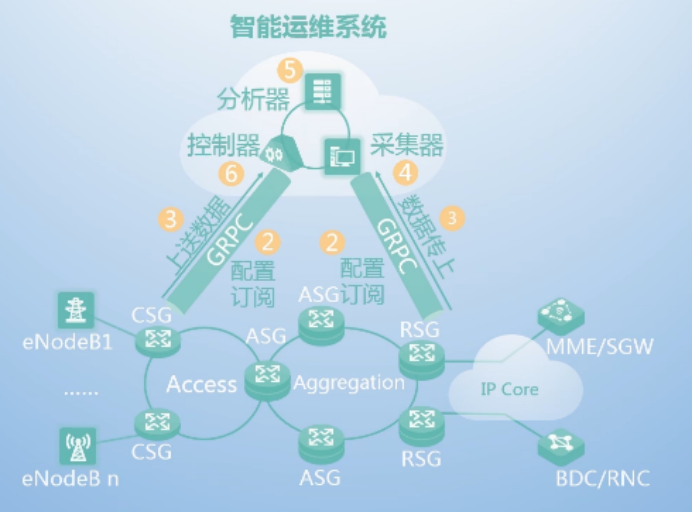
In the carrier's mobile urban network, when the traffic path needs to be optimized, the Telemetry technology is used to collect device data and send it to the analyzer for comprehensive analysis and decision-making. The analyzer then sends the decision to the controller, and then the controller adjusts the device data. control, and then adjust the traffic forwarding path. The detailed deployment process is as follows:
1. Configure the telemetry function.
2. Each device actively establishes a gRPC channel with the intelligent operation and maintenance system, and configures subscriptions on the device.
3. Each device reports the subscribed data to the collector through the gRPC channel.
4. The collector receives, stores, and processes the data reported by each device.
5. The analyzer performs analysis based on the big data analysis system.
6. The controller issues tuning commands to tune the network.
Summarize
Against the background of cloud-native platforms and big data applications, the wide application of Telemetry network telemetry technology has brought significant advantages such as small performance loss, real-time high-precision monitoring of network data, and discovery and positioning of microbursts (Mirco Bursts). ) caused network problems, providing a new idea for network O&M under cloud-network integration.