Ten pictures and five questions will give you a thorough understanding of Kafka architecture tuning
2022.04.11

Ten pictures and five questions will give you a thorough understanding of Kafka architecture tuning
Today, I will share with you the techniques of Kafka architecture tuning. There is a lot of dry stuff in this article, I hope you can read it patiently.
1 Do you know how Kafka's ultra-high concurrency network architecture is designed?
We know that the Kafka network communication architecture uses Java NIO and the Reactor design pattern. Let's first look at the complete network communication layer architecture as a whole, as shown in the following figure:
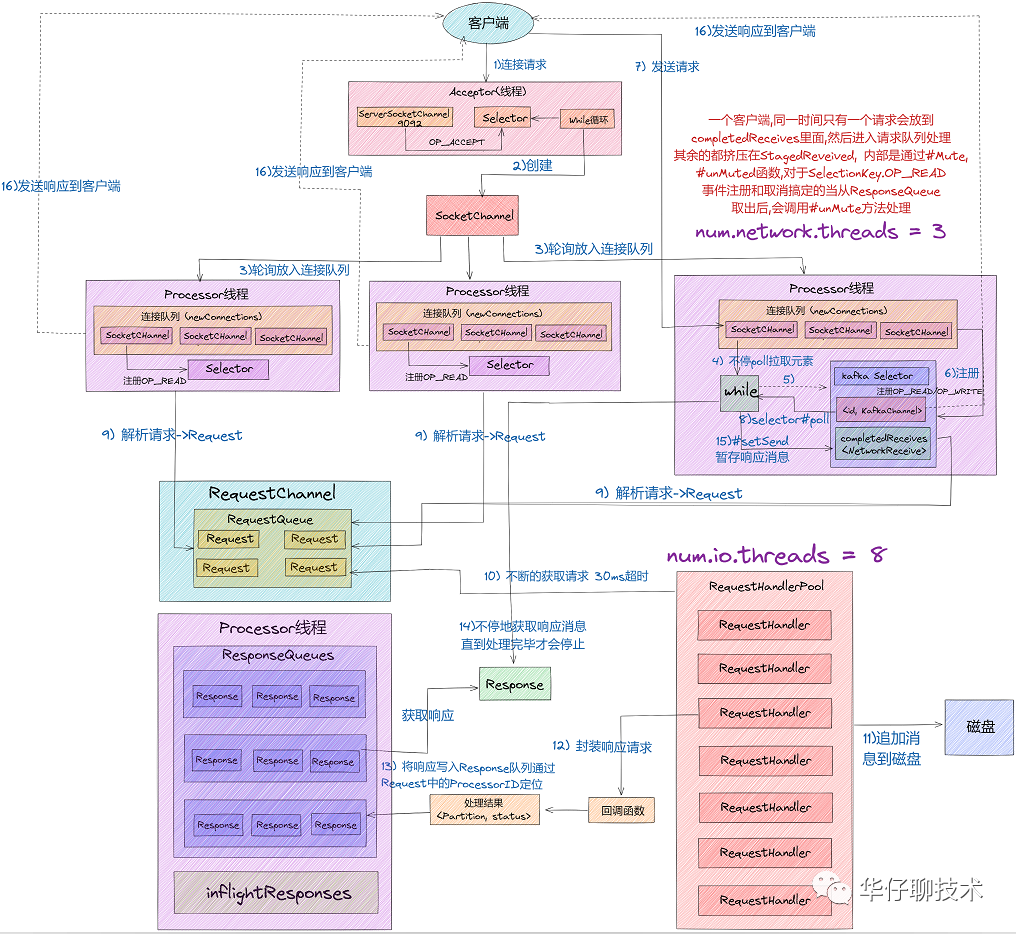
1) From the above figure, we can see that the components used in the Kafka network communication architecture are mainly composed of two parts: SocketServer and RequestHandlerPool.
2) The SocketServer component is the most important sub-module in Kafka's ultra-high concurrency network communication layer. It contains objects such as Acceptor thread, Processor thread and RequestChannel, all of which are an important part of network communication.
3) The RequestHandlerPool component is what we often call the I/O worker thread pool, which defines several I/O threads, which are mainly used to execute real request processing logic.
01 Accept thread
In the classic Reactor design pattern, there is a "Dispatcher" role, which is mainly used to receive external requests and distribute them to the actual processing threads below. In the Kafka network architecture design, this Dispatcher is the " Acceptor thread", a thread used to receive and create external TCP connections. Only one Acceptor thread is created for each SocketServer instance on the Broker side. Its main function is to create a connection and pass the received Request request to the downstream Processor thread for processing.
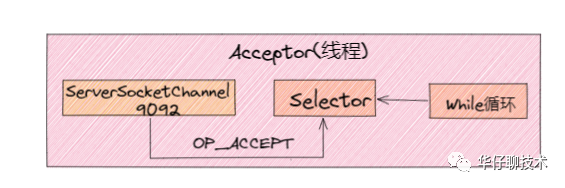
1) We can see that the Acceptor thread mainly uses Java NIO's Selector and SocketChannel to loop and poll ready I/O events.
2 ) Register the ServerSocketChannel channel to nioSelector, and pay attention to the network connection creation event: SelectionKey.OP_ACCEPT.
3) After the event is registered, once the connection request is subsequently received, the Acceptor thread will specify a Processor thread, hand the request to it and create a network connection for subsequent processing.
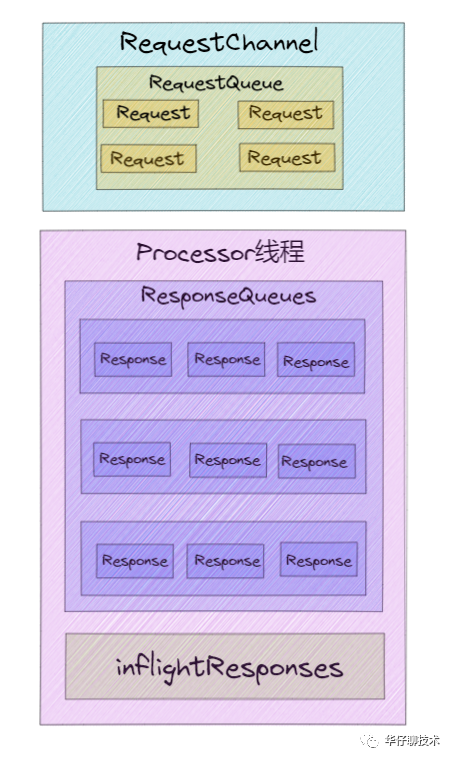
02 Processor thread
The Acceptor only processes the request entry connection, so the real creation of the network connection and the distribution of the network request is done by the Processor thread. And each Processor thread creates 3 queues when it is created.
1) newConnections queue : It is mainly used to save the new connection information to be created, that is, the SocketChannel object. Currently, the length of the hard-coded queue is 20. Whenever the Processor thread receives a new connection request, it will put the corresponding SocketChannel object into the queue, and when the connection is created later, obtain the SocketChannel from the queue, and then register the new connection.
2) inflightResponse queue: It is a temporary Response queue. When the Processor thread returns the Repsonse to the Client, it will put the Response into the queue. The meaning of its existence: Since some Response callback logic cannot be executed until the Response is sent back to the Request sender, it needs to be temporarily stored in a temporary queue.
3) ResponseQueue queue: It mainly stores all Response objects that need to be returned to the Request sender . Each Processor thread maintains its own Response queue.

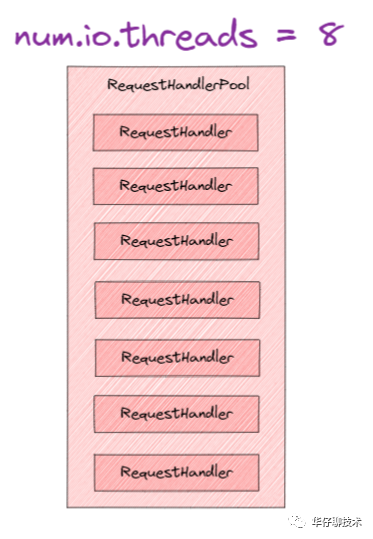
03 RequestHandlerPool thread pool
Acceptor thread and Processor thread are just "porters" of requests and responses, and " really processing Kafka requests " is the KafkaRequestHandlerPool thread pool. In the above network high-concurrency communication architecture diagram, there are two parameters that are related to the entire process , namely " num.network.threads ", "num.io.threads". Where num.io.threads is the size configuration of the I/O worker thread pool.
Let's combine the Kafka ultra-high concurrency network architecture diagram to explain the next complete request processing core process:
1) Clients send requests to the Acceptor thread.
2) The Acceptor thread creates the NIO Selector object, creates the ServerSocketChannel channel instance, and binds the Channel and OP_ACCEPT events to the Selector multiplexer.
3) The Acceptor thread creates 3 Processor thread parameters by default: num.network.threads, and polls the request object SocketChannel into the connection queue.
4) At this time, the connection queue has a steady stream of request data, and then continuously executes NIO Poll to obtain the I/O events that are ready on the corresponding SocketChannel.
5) The Processor thread registers the OP_READ/OP_WRITE event with the SocketChannel, so that the request sent by the client will be obtained by the SocketChannel object, specifically the processCompleteReceives method.
6) At this time, the client can send requests continuously, and the server continuously obtains the ready I/O events through the Selector NIO Poll.
7) Then obtain the completed Receive object from the Channel, construct the Request object, and store it in the RequestQueue request queue of the Requestchannel.
8) At this time, the I/O thread pool comes into play. The KafkaRequestHandler thread cyclically obtains the Request instance from the request queue RequestQueue, and then passes it to the handle method of KafkaApis to execute the real request processing logic and finally store the data to the disk. .
9) After processing the request, the KafkaRequestHandler thread will put the Response object into the Response queue of the Processor thread.
10) Then the Processor thread continuously locates and takes out the Response object from the Response queue through the ProcessorID in the Request, and returns it to the Request sender.
2 Do you know how Kafka's high-throughput log storage architecture is designed?
For Kafka, it is mainly used to process massive data streams. The features of this scenario mainly include:
1) Write operation: The write concurrency requirements are very high, basically reaching millions of TPS, and the log can be added sequentially without considering the update operation.
2) Read operation: Compared with the write operation, it is relatively simple, as long as it can be queried efficiently according to certain rules, and supports (offset or timestamp) reading.
According to the above two points of analysis, for write operations, the " sequentially appending write log " method can directly meet Kafka's requirements for writing efficiency of millions of TPS.
How to solve the efficient query of these logs? We can imagine that the Offset of the message is designed as an ordered field, so that the messages are stored in an orderly manner in the log file, and there is no need to introduce additional hash table structure, and the message can be directly divided into several blocks. For each block, we only need to index the Offset of the first message of the current block. Does this mean a bit of a binary search algorithm? That is, first find the corresponding block according to the Offset size, and then search sequentially from the blocks. As shown below:
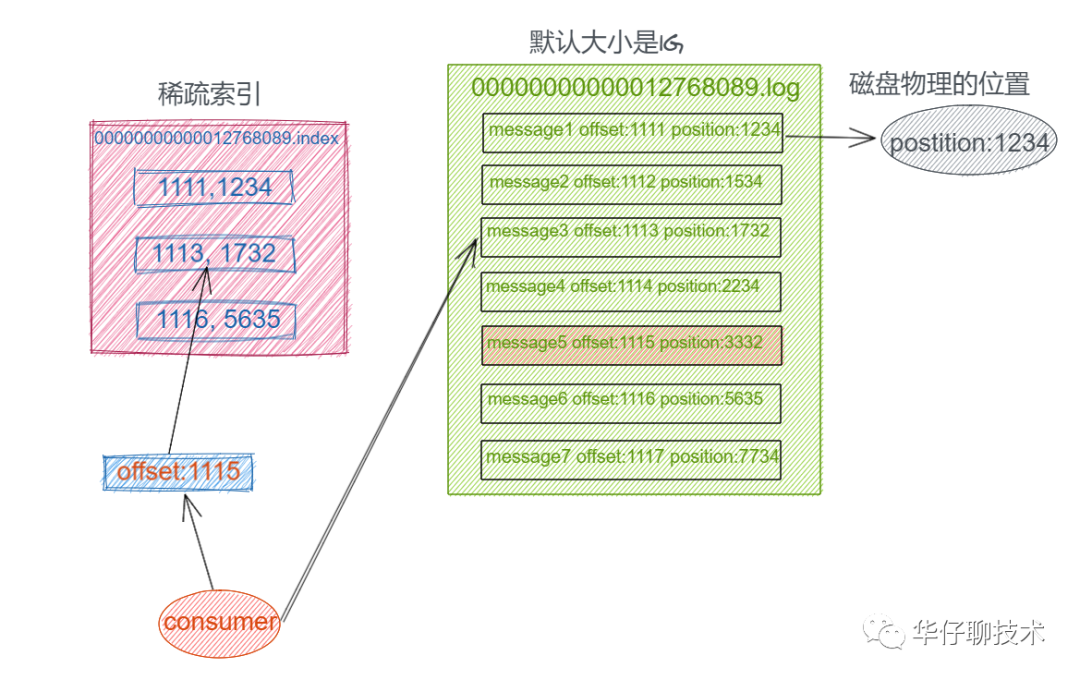
In this way, you can quickly locate the location of the message you are looking for. In Kafka, we call this index structure " sparse hash index " .
The above is the final storage implementation scheme of Kafka, that is, based on sequential append write log + sparse hash index.
Next, let's take a look at the Kafka log storage structure:
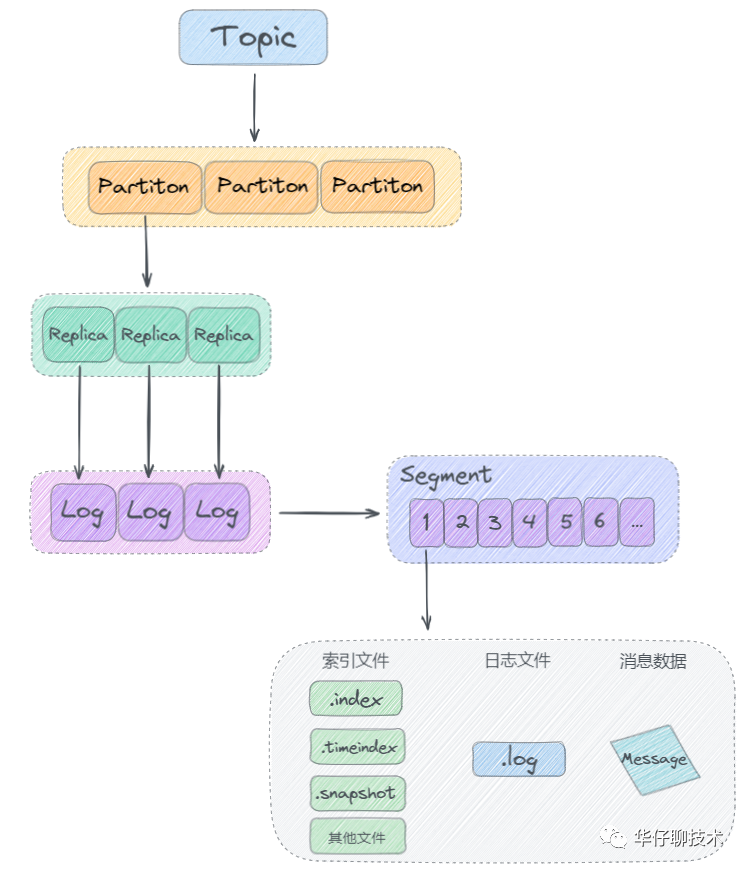
As can be seen from the above figure, Kafka stores logs based on the structure of " topic + partition + copy + segment + index".
After understanding the overall log storage architecture, let's take a look at the Kafka log format. The Kafka log format has also undergone multiple version iterations. Here we mainly look at the log format of the V2 version:
From the above figure, it can be concluded that the V2 version log format mainly improves the space utilization rate of the message format through variable length , and extracts some fields into the message batch (RecordBatch), and the message batch can store multiple messages. , so that disk space can be greatly saved when sending messages in batches.
Next, let's take a look at the overall process of writing log messages to disk as shown in the following figure: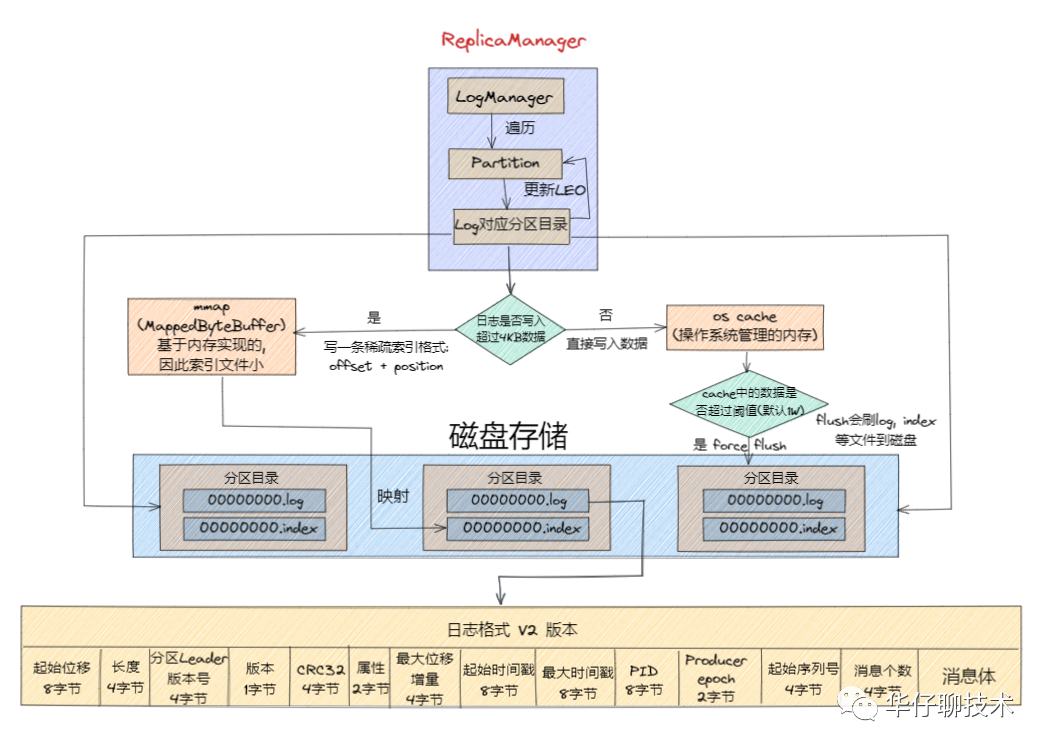
3 For the Kafka online cluster deployment solution, how did you do it?
Here we start from the necessary capabilities of architects, and take the e-commerce platform as an example to describe how to do the Kafka production-level capacity evaluation plan. How to get company leaders and operation and maintenance departments to be recognized and approved for your plan.
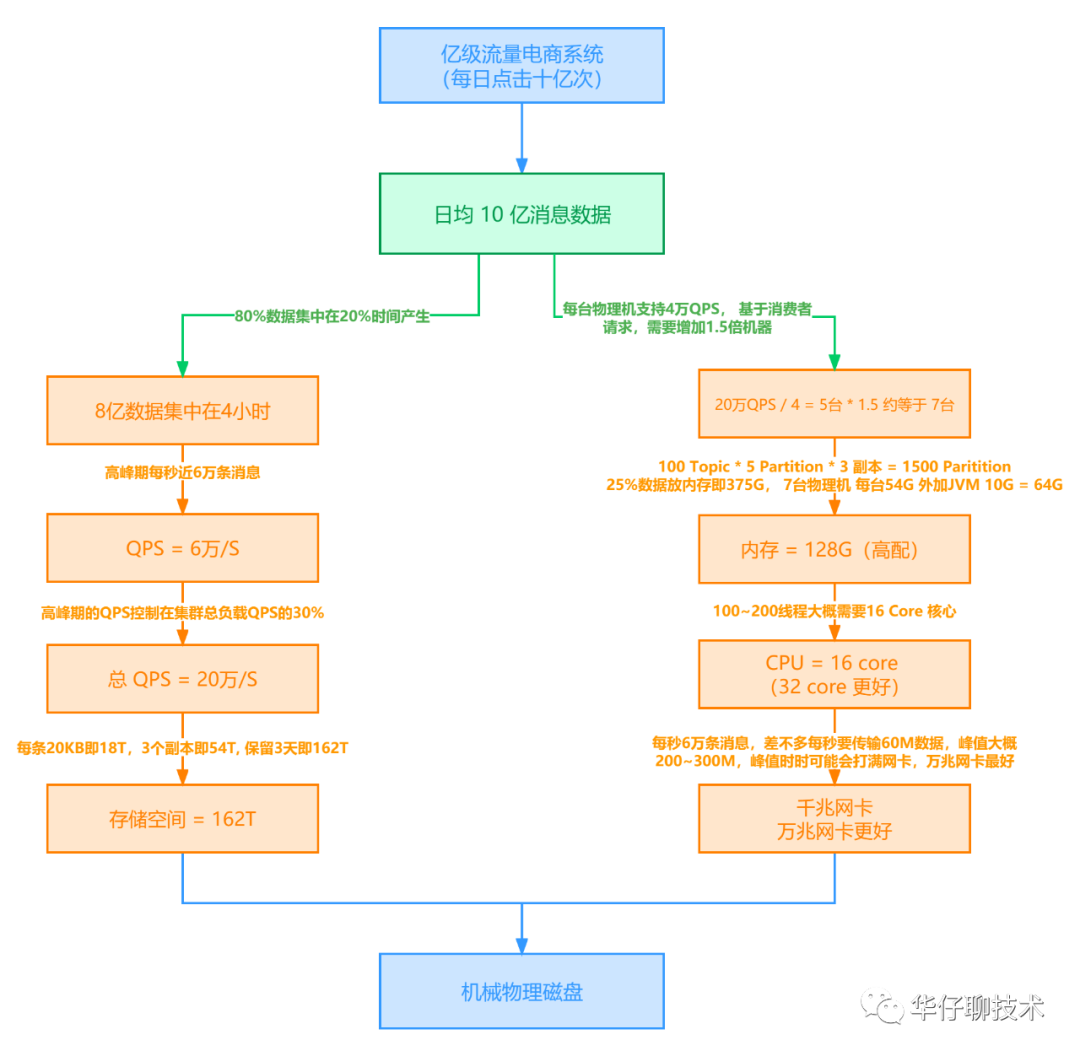
For details, you can read deeply: Eight steps will take you to deeply analyze the Kafka production-level capacity evaluation plan
4 How do you monitor the Kafka online system?
As an important part of the large-scale system architecture, Kafka plays a pivotal role. Therefore, the stability of the Kafka cluster is particularly important. We need to monitor the production Kafka cluster in an all-round way. Generally, the online system can be monitored from the following five dimensions:
01 Host node monitoring
The so-called host node monitoring is to monitor the performance of the node machine where the Kafka cluster Broker is located. Host node monitoring is the most important for Kafka, because many online environment problems are first due to some performance problems of the host.
Therefore, for Kafka, host monitoring is usually the first step to find problems. The main performance indicators are as follows:
" Machine Load (Load)", " CPU Usage", " Memory Usage", " Disk I/O Usage ", " Network I/O Usage", " TCP Connections", " Open Files", " inode usage ".
If you want to better monitor host performance, there are two tutorials you can learn and refer to:
02 JVM monitoring
Another important monitoring dimension is JVM monitoring. Monitoring the JVM process is mainly to give you a comprehensive understanding of the Kafka Broker process.
To monitor JVM processes, there are 3 metrics to focus on:
"Monitor the frequency and duration of Full GC", " Monitor the size of active objects on the heap ", " Monitor the total number of application threads "
03 Kafka cluster monitoring
Another important monitoring dimension is the monitoring of Kafka Broker clusters and various clients. There are three main methods:
1) View important logs on the Broker side: it mainly includes the server log server.log on the Broker side, the controller log controller.log and the topic partition state change log state-change.log. Among them, server.log is the most important. If your Kafka cluster fails, you should check server.log as soon as possible to locate the cause of the failure.
2) View the running status of key threads on the Broker side, for example:
Log Compaction thread: Log compaction cleanup. Once it dies, all Compaction operations are interrupted, but the user is usually unaware of this.
Thread for replica pulling messages: It mainly executes the logic of pulling messages from the Follower replica to the Leader replica. If they fail, the system will behave as Follower replicas delay Leader replicas getting bigger and bigger.
3) View the key JMX performance indicators on the Broker side: mainly include BytesIn/BytesOut, NetworkProcessorAvgIdlePercent, RequestHandlerAvgIdlePercent, UnderReplicatedPartitions, ISRShrink/ISRExpand, ActiveControllerCount.
04 Kafka client monitoring
Client monitoring is mainly the monitoring of producers and consumers. The producers send messages to Kafka. At this time, we need to know the round-trip delay RTT between the client machine and the Broker machine. For cross-data centers or remote clusters , the RTT will be larger, and it is difficult to support a large TPS.
Producer perspective: request-latency is a JMX indicator that needs to be paid attention to, that is, the delay of message production requests; in addition, the running status of the Sender thread is also very important. If the Sender thread hangs, it will not be perceived by the user, and the appearance is only on the Producer side. Message sending failed.
Consumer perspective: For Consumer Group, you need to focus on the join rate and sync rate indicators, which indicate the frequency of rebalance. In addition, it also includes message consumption offset, message accumulation number, etc.
05 Monitoring between brokers
The last monitoring dimension is the monitoring between brokers, which mainly refers to the performance of replica pulling. The follower copy pulls the data of the leader copy in real time. At this time, we hope that the pull process will be as fast as possible . Kafka provides a particularly important JMX indicator called "under replicated partitions " , which means that, for example, we stipulate that this message should be saved on two brokers. Assuming that only one broker saves the message, then the partition where the message is Located Called under replicated partitions, this situation is of particular concern because it may cause data loss.
Another important indicator is "active controller count" . In the entire Kafka cluster, it should be ensured that the index of only one machine is 1, and all others should be 0. If one machine is found to be greater than 1, it must be a split-brain. At this time, you should check whether there is a network partition. Kafka itself cannot resist split-brain, and it relies entirely on Zookeeper to do it, but if there is a network partition, there is no way to deal with it, and it should fail to restart quickly.
5 How did you tune the Kafka online system?
For Kafka, " throughput " and " latency " are very important optimization metrics.
Throughput TPS: refers to the number of messages that the broker or client can process per second, the bigger the better.
Latency: Indicates the time interval from when the Producer sends a message to the Broker's completion of persistence to the Consumer's successful consumption. Contrary to throughput TPS, the lower the latency, the better.
In conclusion, high throughput and low latency are our main goals for tuning Kafka clusters.
01 Increase throughput
The first is to improve throughput parameters and measures:
Broker | num.replica.fetchers: Indicates how many threads follower replicas use to pull messages, the default is 1 thread. If the CPU resource on the Broker side is sufficient, increase the value appropriately " but not more than the number of CPU cores" to speed up the synchronization speed of the follower copy. This is because in a production environment, the primary factor affecting throughput on the Producer side configured with acks=all is the replica synchronization performance. By increasing this value appropriately, you can usually see an increase in the throughput of the Producer side |
replica.lag.time.max.ms: In ISR, if a follower does not send a communication request or synchronization data to the leader for a long time, the follower will be kicked out of the ISR, the default value is 30s. | |
num.network.threads: The number of threads for a single Acceptor to create a Processor processor, the default value is 3, and the value can be appropriately increased to 9. | |
num.io.threads: The number of threads used by the server to process requests, which may include disk I/O. The default value is 8, which can be appropriately increased to 32. | |
Tuning parameters to avoid frequent Full GC | |
Producer | batch.size: Indicates the message batch size, the default is 16kb. If the batch setting is too small, it will cause frequent network requests and reduce throughput; If the batch setting is too large, it will cause a message to wait for a long time to be sent out, increasing the network delay. Therefore, an appropriate increase will improve the throughput. It is recommended to increase from the default 16kb to 512kb or 1M. |
buffer.memory: The total size of the buffer that RecordAccumulator sends messages. The default value is 32M, which can be increased to 64M. | |
linger.ms: Indicates the batch cache time. If the data does not reach batch.size, the sender will send the data after waiting for linger.ms. The unit is ms, the default value is 0, which means that the message must be sent immediately. If the setting is too short, it will cause frequent network requests and reduce throughput; If the setting is too long, it will cause a message to wait for a long time to be sent out, increasing the network delay. Therefore, an appropriate increase will improve the throughput, and 10~100 milliseconds is recommended. | |
compression.type: The default is none, no compression, but lz4 compression can also be used, and the efficiency is still good. After compression, the amount of data can be reduced and the throughput can be improved, but it will increase the CPU overhead on the producer side. Supported compression types: none, gzip, snappy, lz4, and zstd. | |
Set acks=0/1, retries=0, the optimization goal is throughput, do not set acks=all " replica synchronization time extension " and turn on retry " execution time extension " . | |
Consumer | Leverage multithreading to increase overall throughput |
fetch.min.bytes: Indicates how much data is accumulated on the Broker side, it can be returned to the Consumer side. The default value is 1 byte, and the value can be increased appropriately to 1kb or larger. | |
fetch.max.bytes: The maximum number of bytes that the consumer fetches from a batch of messages from the server. The size of a batch is affected by message.max.bytes [broker configuration] or max.message.bytes [topic config ], the default is 50M. | |
max.poll.records: Indicates the maximum number of messages returned by one poll pulling data, the default is 500. | |
partition | Add partitions to improve throughput |
02 Reduce the delay
The purpose of reducing the delay is to minimize the end-to-end delay.
Compared with the above parameters for improving throughput, we can only adjust the parameter configuration on the Producer side and the Consumer side.
For the Producer side, at this time, we want to send the message quickly. We must set linger.ms=0, turn off compression, and set acks=1 to reduce the replication synchronization time.
For the Consumer side, we only keep fetch.min.bytes=1, that is, as long as there is data that can be returned on the Broker side, it will be returned to the Consumer immediately to reduce the delay.
03 Reasonably set the number of partitions
The number of partitions is not as high as possible, nor is the number of partitions as good as possible. You need to build a cluster, perform stress testing, and then flexibly adjust the number of partitions.
Here, you can use the script provided by Kafka to perform stress testing on Kafka.
1) Producer stress test: kafka-producer-perf-test.sh
2) Consumer stress test: kafka-consumer-perf-test.sh